How to Follow Cryptocurrency Charts?
Cryptocurrencies and the financial order around them raise the issue of financial literacy. In the crypto money ecosystem, whose popularity and recognition is increasing day by day, the main goal of investors is to make a profit as in every investment. Individuals or companies conduct personal risk analyses while aiming to make a profit. As a result of this analysis, it uses some indicators and tools to minimize its risks. In a situation where risk management is not done, investors risk losing the resources they hold in exchange for the risk they have taken. At this stage, basic graphic reading information is needed. Reading graphs can seem complicated and confusing. However, when it comes to work, it has an easy structure to learn and develop.
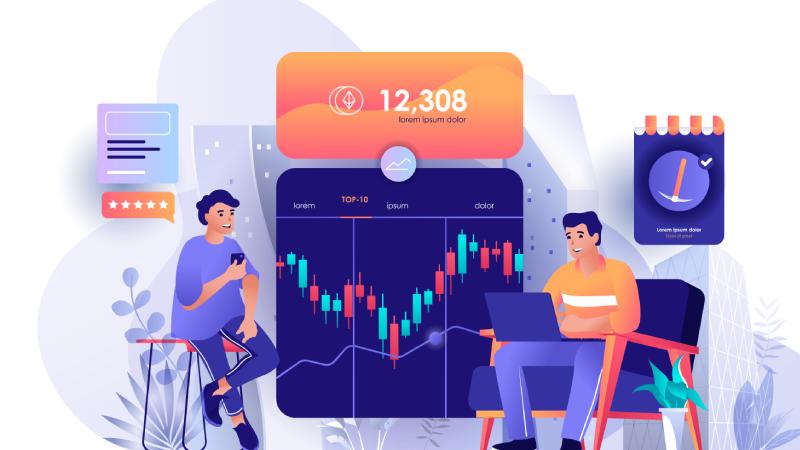
When the charts of the crypto currencies are examined, the predictions on the crypto
money
examined with instant, minute, hourly, daily and many more options can be provided through the chart. In the chart analyzes made in our stock exchange, we offer you analyzes over candlestick charts. The first thing to know when reading a chart is to know what the green and red columns mean. The candlestick charts that we have used in the charts we have used give us the price information for the selected time frame on the chart. A single candlestick chart offers us 6 different data. Thanks to this data, information about the price and movements of the analyzed crypto money is obtained. When you want to do a live analysis, a chart reading by simply doing a candlestick chart analysis will often not be enough. After selecting the time frame of the crypto money to be analyzed, the indicators can be used.
When reading the charts, support and resistance points should be identified, and their interpretation together with other indicators will reduce the risk when the price movements of the analyzed cryptocurrency are examined. As a result of this analysis, directing your investments will reduce the risk of your investments. If the crypto money analysis is made instantly, instant price movements can be observed. In this way, up-to-date information about the crypto money market is obtained. Thus, instant management of your investments can be provided. At a moment of momentary high price movements, it will not be affected by the positive or negative situations that this price movement will bring.
How is Analysis Done in ICRYPEX?
In our stock exchange, the “Daily Bulletin” and “Weekly Bulletin” on our crypto money analysis site are also shared daily. In our analysis, support and resistance points, the channel where the price movement is experienced and other indicators and expectations about the price are shared. During this analysis, indicators such as MACD, DEMA, TOBO, RSI and Fibonacci are used. In the “Research” section, where some crypto coins in our stock exchange are analyzed, the analyzed crypto coins are not only interpreted on the chart. Within the analyzes, daily news, changes that future developments may make on the price and targeted projects are also mentioned. As a result of the analyzes made as a whole, the general course of prices and expectations are shared.