
What is Death Cross?
It has always been desired to know the direction of an investment instrument or the market , and it does not seem like this habit will change much after today. Technical analysis is considered a good friend for investors who want to make predictions in this context for the short and distant future. So, what is Death Cross?
Death Cross, a chart pattern among technical analysis tools, has the potential to be a harbinger of a downward trend in the market. It is used in markets such as crypto money, stocks and commodities. Basically “What is death cross?” In this content where we will address the question, we will take a closer look at this term, which is considered an important tool for financial markets. Maybe he can be a good friend for you in understanding whether a downtrend is coming to the market or not. To this, “What does Death Cross mean?” It can be decided in the title and in the following parts of our article.
What Does Death Cross Mean?

A Death Cross occurs when the short-term moving average falls below the long-term moving average. This is called the Death Cross formation. This term, known as death cross in Turkish, can help investors make the right decisions at the right time. “What does Death Cross mean?” In order to answer the question more clearly, it would be useful to briefly explain the moving time average.
A moving average can be explained as the average of various price ranges of an asset over a period of time, and this average changes as time goes by. Moving averages are plotted next to prices on a price chart where the x-axis reflects time and the y-axis reflects price . Moving averages form smooth lines, unlike the spiky patterns formed by prices. When a market price line crosses a key moving average line, this can be considered a bullish signal. When a price line crosses below an important moving average line, this development can be perceived as a bearish signal.
Typically on price charts, moving average lines for different time periods are given different colors . Such an application makes it easier to follow their progress over time. A Death Cross or Golden Cross occurs when certain moving average lines intersect.
Of course, it is worth remembering this: In order for technical analysis methods known as indicators, formations and charts to be considered a meaningful signal, they must have been repeated many times before, when looked at retrospectively. At this point, investors or people interested in technical analysis need to take into account market evaluations and news flows in addition to technical analysis in order to make the right trading decisions.
What is the Death Cross Formation?
It is stated that the Death Cross formation occurs when the 50- day moving average and the 200 -day moving average are used. To understand this most clearly, the following example can be used.
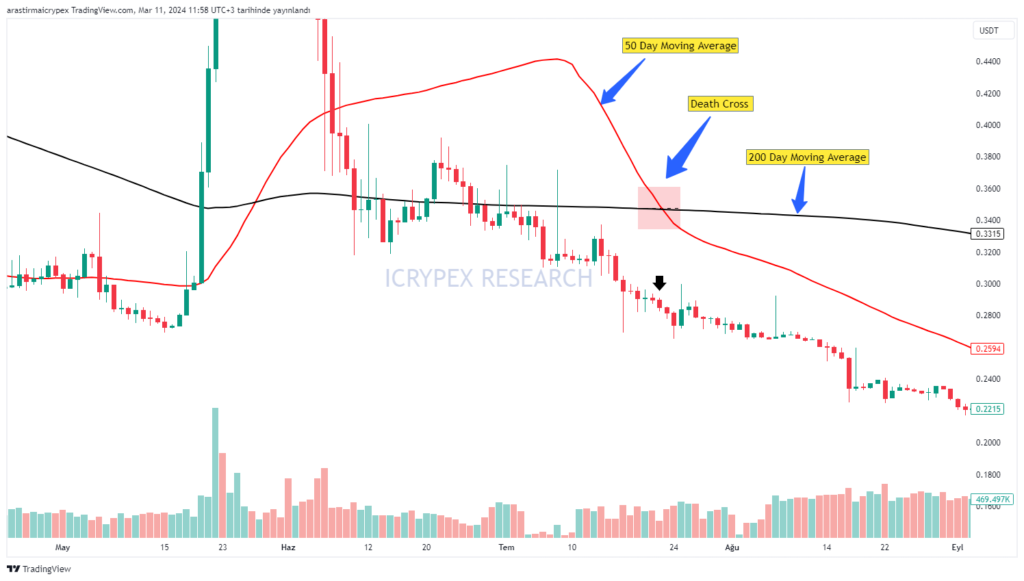
The Death Cross, formed when the red 50-day moving average falls below the black 200-day moving average, can be easily seen in this chart. This is also called the Death Cross formation. The emergence of the Death Cross refers to a decline in short-term activity and a significant trend towards lower prices.
What Happens If Death Cross Happens?

When a Death Cross occurs in an asset, that is, when the short-term moving average line (usually 50 days) crosses the long-term moving average line (usually 200 days) downwards, it is usually perceived as a signal that the downtrend in the market will strengthen and asset prices may tend to decline further. However, the occurrence of a Death Cross should not be considered as an indicator alone.
A death cross means investors and traders should expect a potential decline in asset prices. In such periods, some investors may sell according to their own strategies or reduce their risks by protecting their open positions. However, it is also possible that some traders may take a reversal position or implement protective measures by following the Death Cross signal.
As a result, since Death Cross is only an indicator and cannot always be accurate, it may be better to evaluate it together with other analysis tools and market conditions. Considering this, it is extremely critical to always consider various factors when making investment decisions.
What are the Death Cross Stages?

The formation of the Death Cross can be divided into three distinct stages, as can be seen below.
- Stage 1: The increasing value of an asset reaches its peak and momentum begins to slow as sellers begin to outnumber buyers.
- Phase 2: The price of the asset begins to decline when the 50-day moving average falls below the 200-day moving average until a Death Cross appears.
- Stage 3: When the Death Cross occurs, it generally signals against the general market downtrend while additional losses have not yet occurred.
If trading volumes increase after the Death Cross appears, this indicates that investors are moving towards selling and the bearish trend is confirmed. These stages of the Death Cross are often taken into consideration by investors and traders who follow market trends.
How is the Death Cross Interpreted?

So far, in general terms, “What is Death Cross?” We answered the question. Now let’s look at how this is interpreted in Death Cross cases.
We have generally mentioned the Death Cross as a signal that the downward trend in the market will strengthen and asset prices may trend further downward. However, interpretation can take several different forms. The difference here may vary depending on the investors’ strategy, risk appetite and market conditions.
Just below you can find some of the different interpretations of the Death Cross.
- Strengthening of Downtrend: Death Cross, if there is already a downtrend in asset prices, investors can infer that this downtrend will become stronger. Investors may choose to sell their assets or reduce their risks if they evaluate this signal.
- Sell Signal: For some investors, the Death Cross may mean that they need to sell their holdings or implement countertrend strategies by taking a short position. This applies to those who want to benefit from further strengthening of the downtrend.
- Taking Protective Measures: There may be investors who want to protect their current positions. In such a case, protective measures such as stop-loss orders after the Death Cross can support their strategy. In this way, precautions can be taken against a potential decline.
- Waiting for a Reverse Signal: For some investors, the Death Cross can be considered as a signal of a complete reversal of the trend in the market. In particular, they can look out for a Golden Cross, a situation where the shorter-term moving average line crosses the longer-term moving average line in an upward direction.
These comments can be evaluated to understand the general perception of Death Cross. Of course, it is important to remember that every investor can interpret this signal in different ways and plan their actions accordingly. However, it should be underlined once again that this interpretation should be considered together with other analysis tools and market conditions.