Bloomberg Analyst's June Forecast for Spot Ethereum ETFs – JPMorgan Says Spot Ethereum ETFs Will See Lower Demand Compared to Bitcoin
June Forecast for Spot Ethereum ETFs from Bloomberg Analyst
U.S. spot Ethereum ETFs could launch in June with updated BlackRock and Grayscale filings, Bloomberg ETF analyst Eric Balchunas said May 30. Balchunas explained that there is a ‘legitimate possibility’ for spot Ethereum ETFs to launch by the end of June. In addition, he considered it unlikely that it would be launched before mid-June.
JPMorgan Says Spot Ethereum ETFs Will See Lower Demand Compared to Bitcoin
In a research report published on Thursday, JPMorgan stated that demand for spot Ethereum ETFs will be much lower than for spot Bitcoin ETFs for obvious reasons. JPMorgan said it expects as much as $3 billion in net inflows into spot Ethereum ETFs over the rest of this year. It was stated that if staking is allowed, this figure could rise up to 6 billion dollars. Analysts explained that Bitcoin has the first advantage and therefore they do not expect a huge inflow into Ethereum ETFs.
Singapore’s DBS Bank Holds $650 Million in Ethereum
A crypto wallet reportedly owned by multinational banking and financial services company DBS Bank holds more than 170,000 Ether worth approximately $650 million. On May 30, blockchain analysis firm Nansen described Singapore banking institution DBS Bank as an ‘Ethereum whale’.
Stablecoin Market Value Reached $161 Billion
In May 2024, the stablecoin ecosystem has rebounded, reaching a market cap of $161 billion, up 0.63% since the beginning of the month. This was the highest level since April 2022. In May, stablecoin dominance fell to 6.07% as crypto assets rebounded after ETF approval.
ARPA Network Provided a Strategic Investment of 6 Million Dollars
ARPA Network, a pioneer in secure decentralized computing, announced a strategic investment of $6 million to support product expansion in fully on-chain gaming, autonomous worlds, and cryptographic artificial intelligence. Lead investors include Nomura’s Laser Digital and DeFiance Capital, with additional funding from Animoca Ventures, Metrics Ventures, ArkStream Capital and Trinito. ARPA Network was previously backed by Binance Labs, Arrington Capital and DWF Labs.
——————————————————————————–
BITCOIN (BTC)
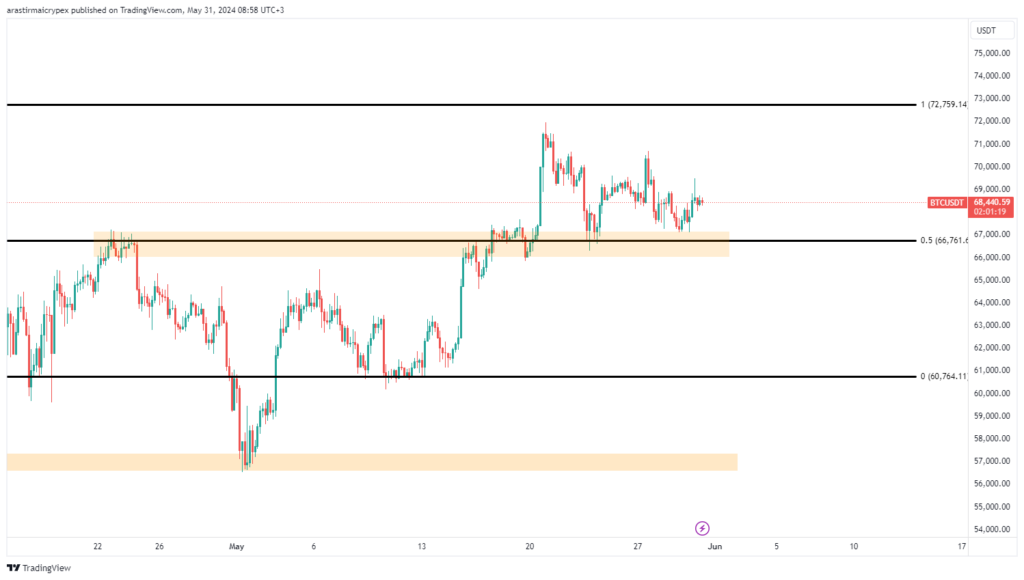
As of the morning hours, BTC is priced at $68,454 with a 0.15% gain in value. The horizontal channel between $75,760 and $60,800 is still maintained. Yesterday, there was an increase up to $69,500, but it could not be sustained. If the pullback continues, $67,000 appears as the first major support. As resistance, $69,500 is currently working. Closings above $69,500 are required for the continuation of the rise.
ETHEREUM (ETH)
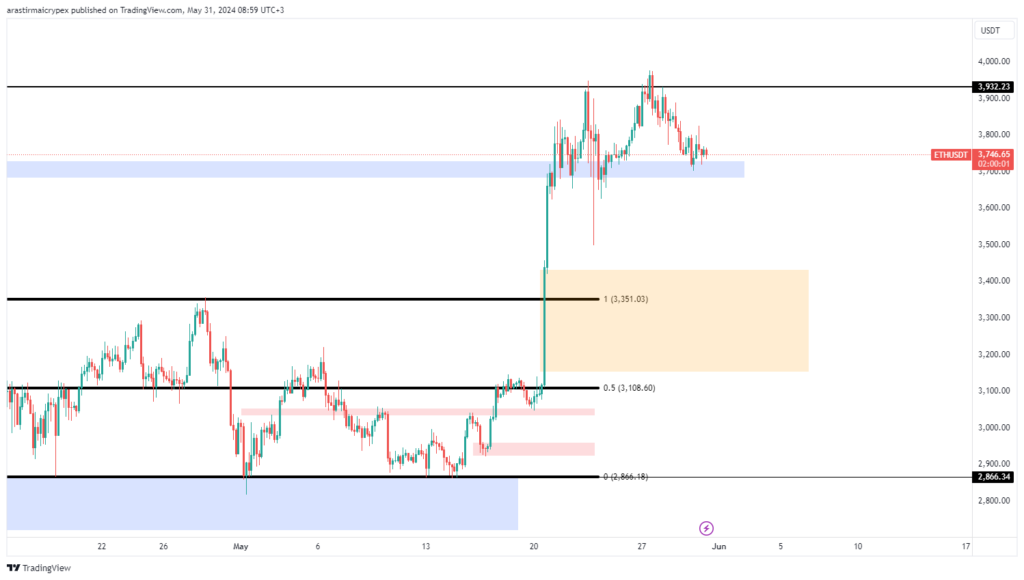
ETH is priced at $3747 with a 0.04% loss of value as of the morning hours. Yesterday, the $3925 level was tried again but was unsuccessful. The upward movement continues in the medium term. In case of a break above $3932, the $4000 level can be tested. The $3750 region appears strong as initial support.
RIPPLE (XRP)
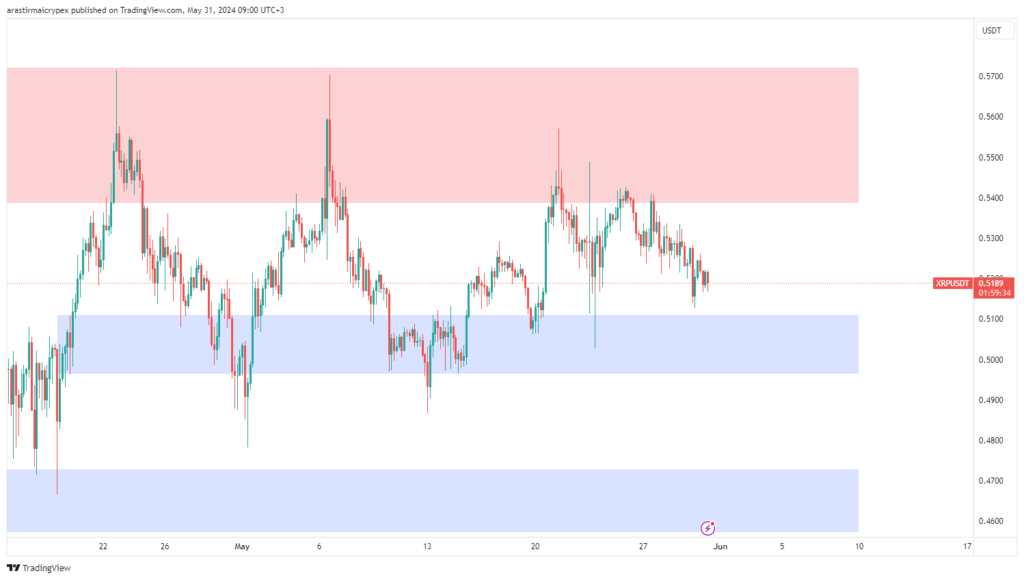
As of the morning hours, XRP is priced at $0.5189 with a 0.08% gain in value. There is a horizontal channel between $0.46 and $0.57. There was a wick movement to the $0.48 level, but it could not be permanent. $0.50 is a critical level and this level has been regained. Initial support again appears to be the range between $0.52 and $0.51. Areas where there may be resistance include the $0.55 and $0.58 levels.
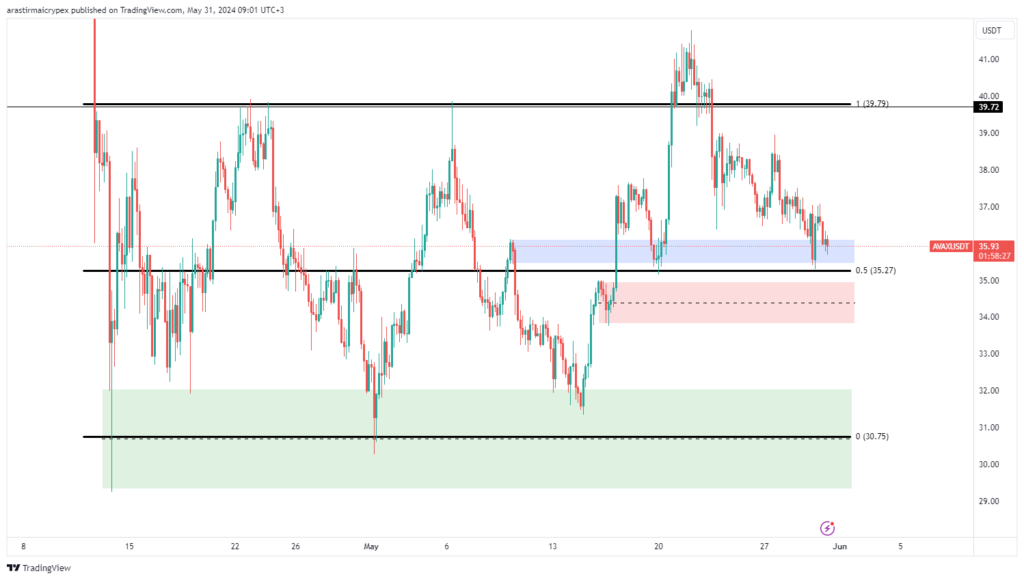
AVALANCHE (AVAX)
AVAX is priced at $35.91 with a 0.11% loss in value as of the morning hours. After the horizontal area broke up, we saw a movement up to the $42 level, but it could not be sustained above this area. In case of withdrawals, the 35 and 33 dollar areas can be followed as support. In upward movements, if there is persistence above the $40 level, the $45 region can be targeted. There is a downward trend in the short term.
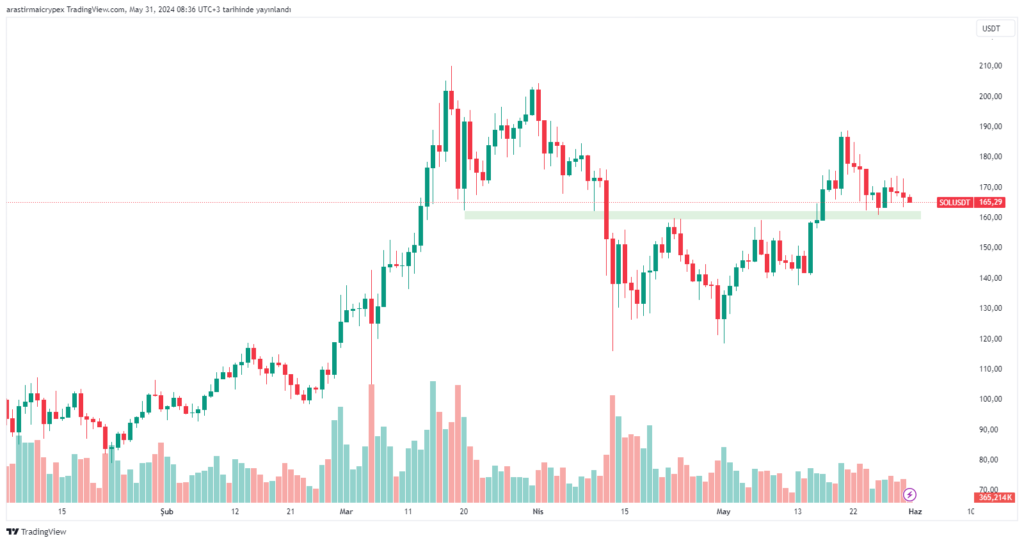
SOLANA (SOL)
SOL is priced at $165.30 with a 0.88% depreciation as of morning hours. When we examine the daily chart, we see that the $160 level, which we follow as the support zone, was tested with the withdrawal movement. If the reaction from this region continues, the $ 170 level can be followed as short-term resistance. If the support zone is broken, a move up to $155 may be possible.
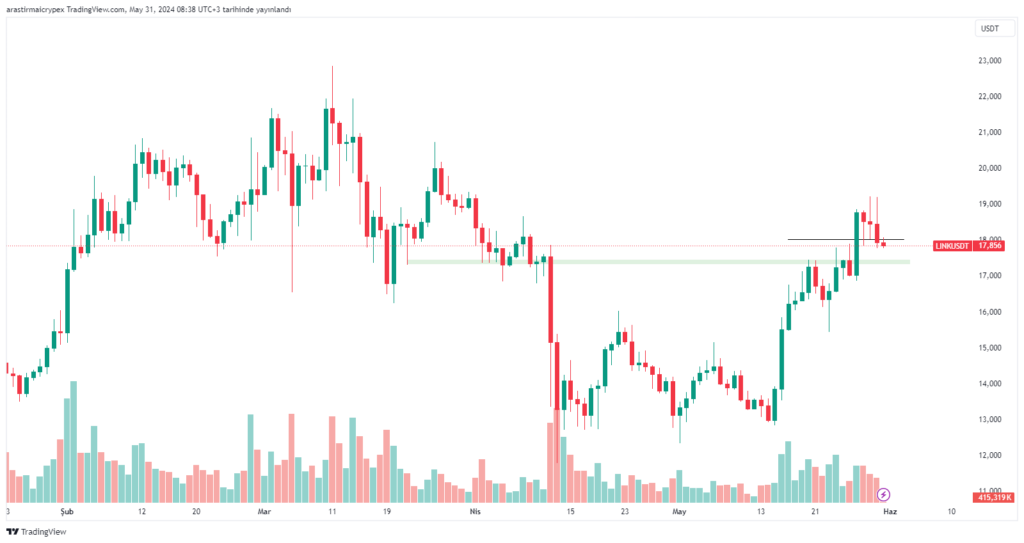
CHAINLINK (LINK)
As of the morning hours, LINK is priced at $17,880, with a 0.33% loss in value. When we examine the daily chart, we see that the $18 level, which we follow as the support zone, has been broken downwards. If this movement continues, the $ 17,400 level appears as support. In upward movements, it is important to maintain permanence above the 18 dollar level.
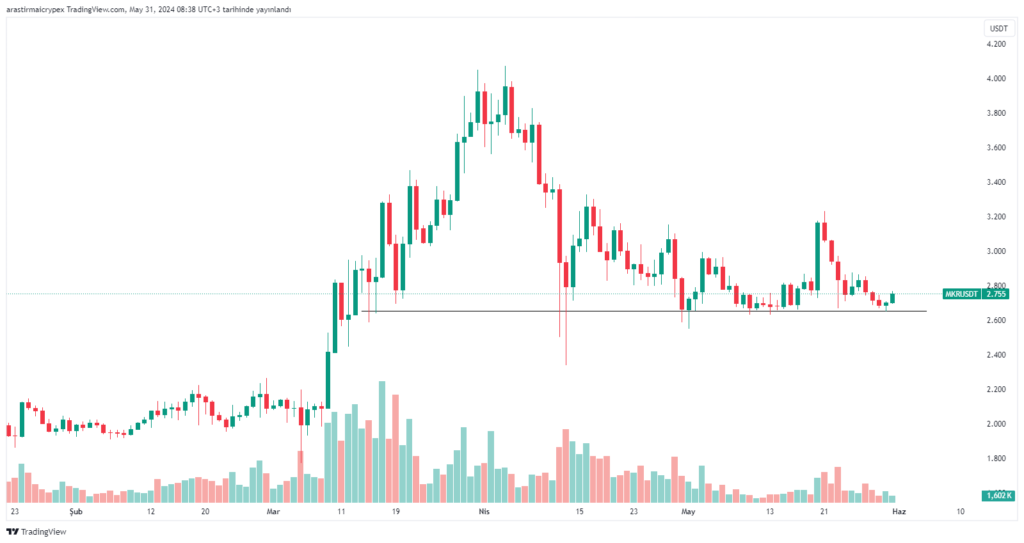
MKR
As of the morning hours, MKR is priced at 2755 dollars with a 1.92% gain in value. When we examine the daily chart, we see that there is an upward reaction movement from the $ 2650 level, which we follow as the support zone. If this movement continues, the $2800 level appears as short-term resistance, and if there is persistence above this region, the $3000 region can be targeted.
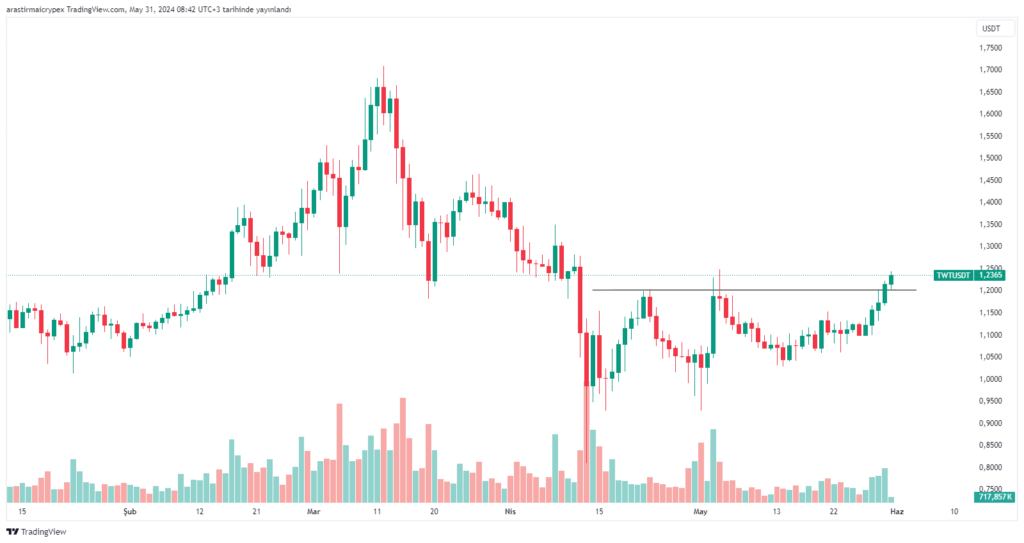
TWT
As of the morning hours, TWT is priced at $1.2359 with a 1.72% gain in value. When we examine the daily chart, we see that the resistance zone has been broken upwards. If this movement continues, first the $1.25 and then $1.30 levels may be tested. In case of a withdrawal, the $ 1.20 level can be followed as support.
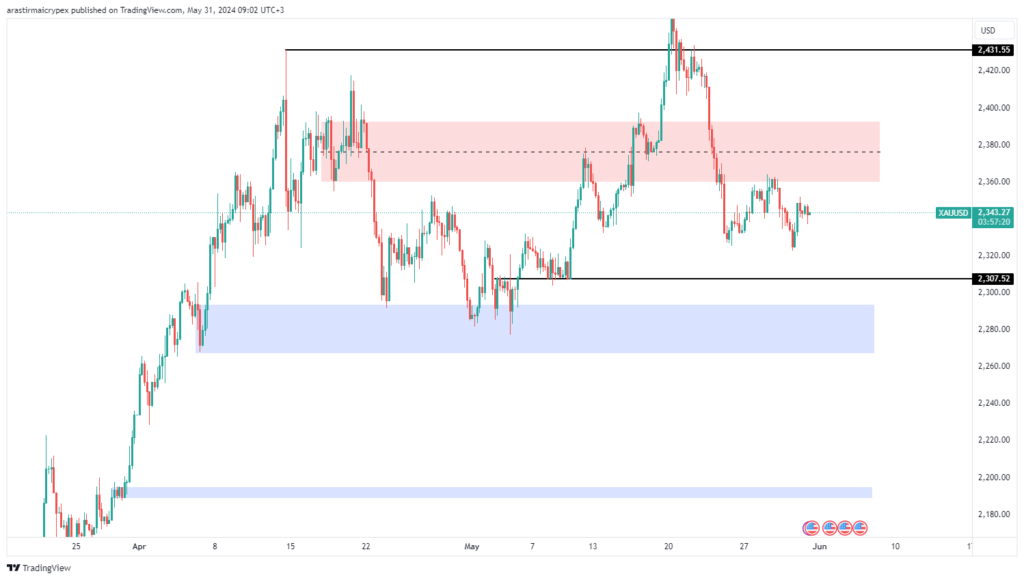
OUNCE OF GOLD
As of the morning hours, ounce gold is priced at 2343 dollars with a 0.02% gain in value. When we examine the four-hour chart, we see that the $2400 level has been broken strongly downwards. We see that it has received a reaction from the $2320 level, which we are currently following as a support zone. If this movement continues, the $2360 level can be followed as resistance. In case of persistence above this resistance, $2375 appears as the next resistance zone. If the current retreat continues, the $2300 level may be tested again.
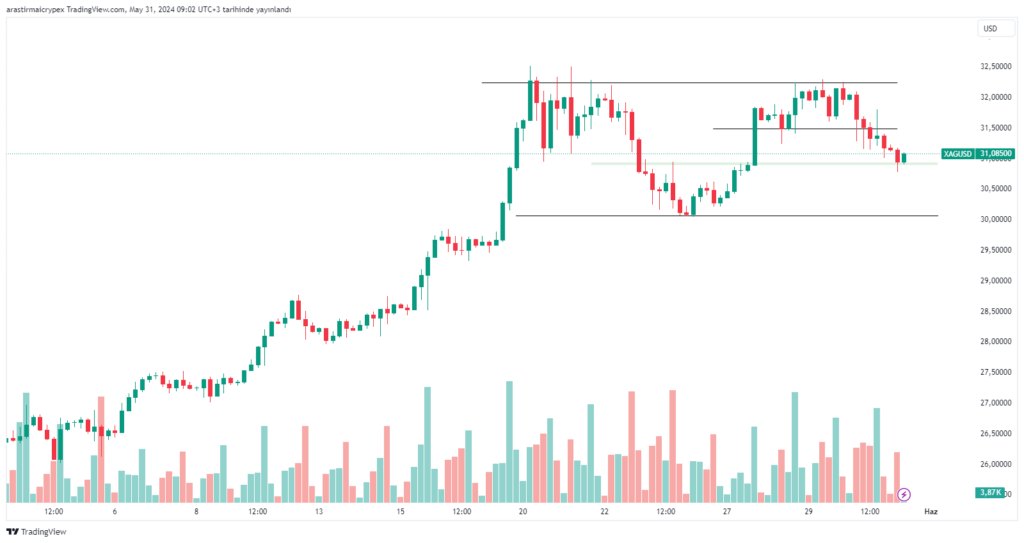
OUNCE OF SILVER
As of the morning hours, silver is priced at $ 31.10 with a 0.26% loss in value. When we examine the four-hour chart, we see that the movement continues after a slight retreat after the rising movement. The $31.50 level appears as the resistance zone. If there is a break above this region, the $32 level can be targeted. In case of withdrawals, the $ 31 level can be followed as support.