Spot Ethereum ETFs Record $24 Million Net Inflows – Ethereum L2 Ecosystem Trades Record 12.4 Million
Spot Ethereum ETFs Record $24 Million Net Inflows
U.S. spot Ethereum ETFs continued their positive trend, recording net inflows of $24.34 million on Tuesday. However, Grayscale’s Ethereum Trust (ETHE) saw an outflow of $31 million, returning to negative flows. BlackRock’s ETHA ETF led the way with inflows of $49.12 million. Total trading volume for Ethereum ETFs fell to $191 million from $285.9 million the day before.
Ethereum L2 Ecosystem Completes Record 12.4 Million Transactions in One Day
Ethereum’s Layer-2 scaling ecosystem hit a record daily transaction count of 12.42 million on August 12. This increase was driven largely by Coinbase’s Layer-2 blockchain Base. Layer-2 networks now hold more stablecoins than Solana and Binance Chain, indicating rapid growth. In contrast, Ethereum’s Layer-1 daily transactions have remained stable.
Three Arrows Capital Liquidators File $1.3 Billion Lawsuit Against TerraForm Labs
Three Arrows Capital liquidators have filed a $1.3 billion lawsuit against TerraForm Labs, alleging that Luna and TerraUSD caused 3AC to suffer major losses through market manipulation. The lawsuit is part of 3AC’s efforts to recover funds for its creditors. The bankrupt TerraForm Labs is currently in liquidation, and recovery of funds remains uncertain.
PYUSD Supply on Solana Surpasses Ethereum by 5.6%
PayPal’s stablecoin PYUSD is seeing a larger supply than Ethereum on the Solana blockchain. Solana has 377 million tokens, while Ethereum has 356 million. This difference comes after PYUSD saw rapid adoption on Solana, with supply increasing by 230% in 30 days. Solana’s lower costs and faster transaction speeds are fueling this growth. PYUSD now ranks as the fourth-largest centralized stablecoin issuer.
Floki Announces Major Advertising Campaign for Valhalla in the English Premier League for the 2024-2025 Season
Floki is launching a major advertising campaign for its PlayToEarn MMORPG Valhalla during the 2024-2025 English Premier League season. The campaign will reach over 200 million global viewers using LED perimeter boards during live matches. The ads are expected to generate approximately 1.2 billion impressions and 440 hours of screen time. The campaign aims to increase Floki’s brand awareness and credibility on a global scale.
————————————————————————————————
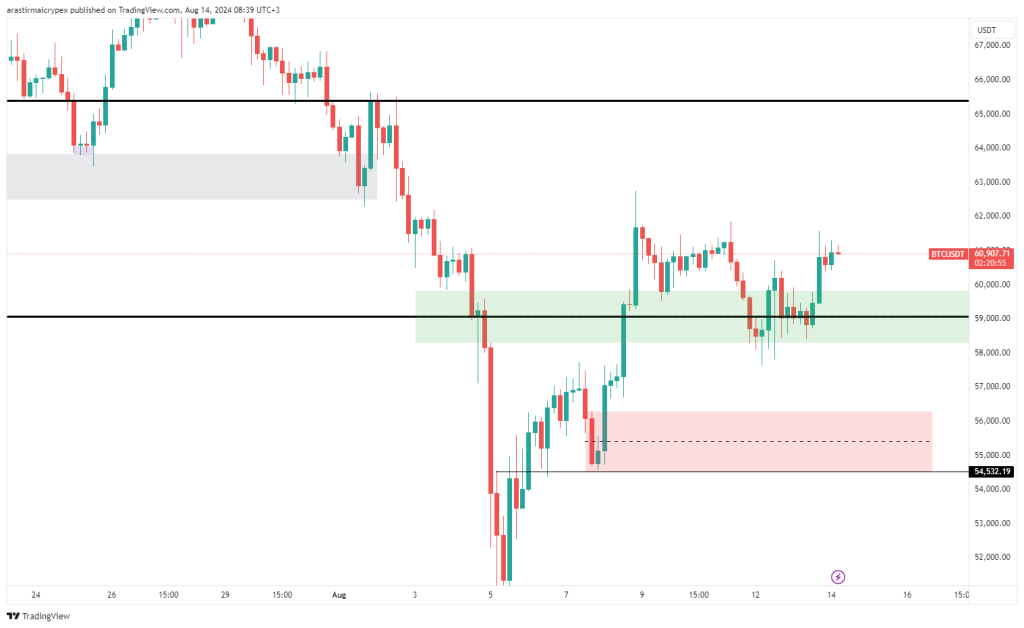
BITCOIN (BTC)
BTC is priced at $60,904 with a 0.52% increase in value as of the morning hours. There was an increase from $48,000 to $62,800, but it could not be sustained. There was an increase to $61,500, but it could not be sustained here either. $60,000 seems strong as the first support area. If there is a price increase above here, increases to $65,000 can be seen. If $60,000 is lost, a pullback to $58,000 can occur.
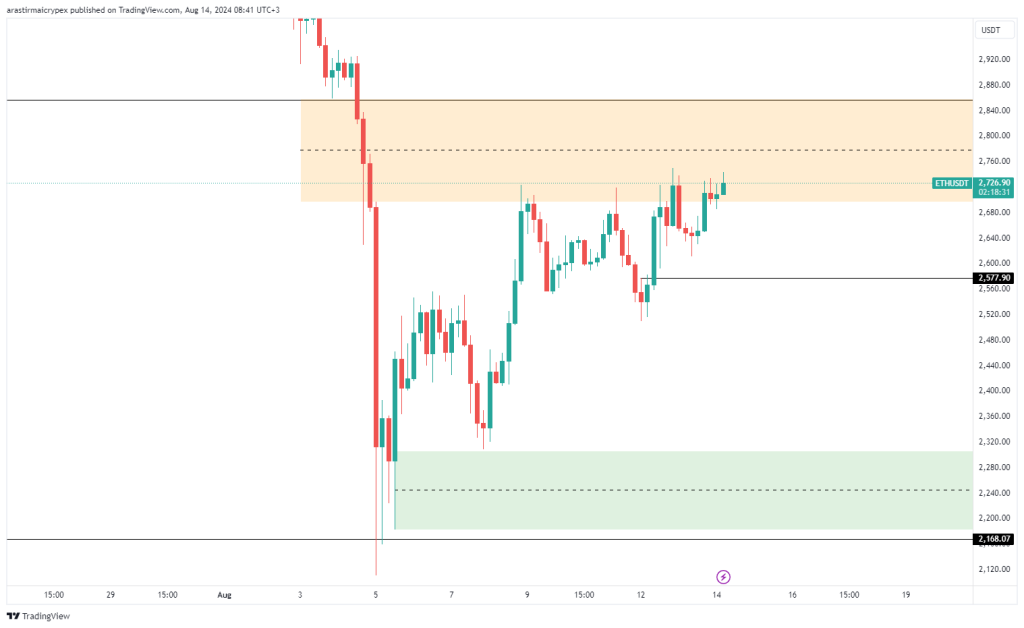
ETHEREUM (ETH)
ETH is priced at $2726 with a 0.89% increase in value as of the morning hours. There was an increase from $2150 to $2700. This time, it is necessary to maintain this level for the increase. In pullbacks, $2400 seems strong after $2500. If there is a break below the $2400 level, pullbacks to $2200 can be seen. If $2780 is broken upwards, pricing up to $3000 can be seen.
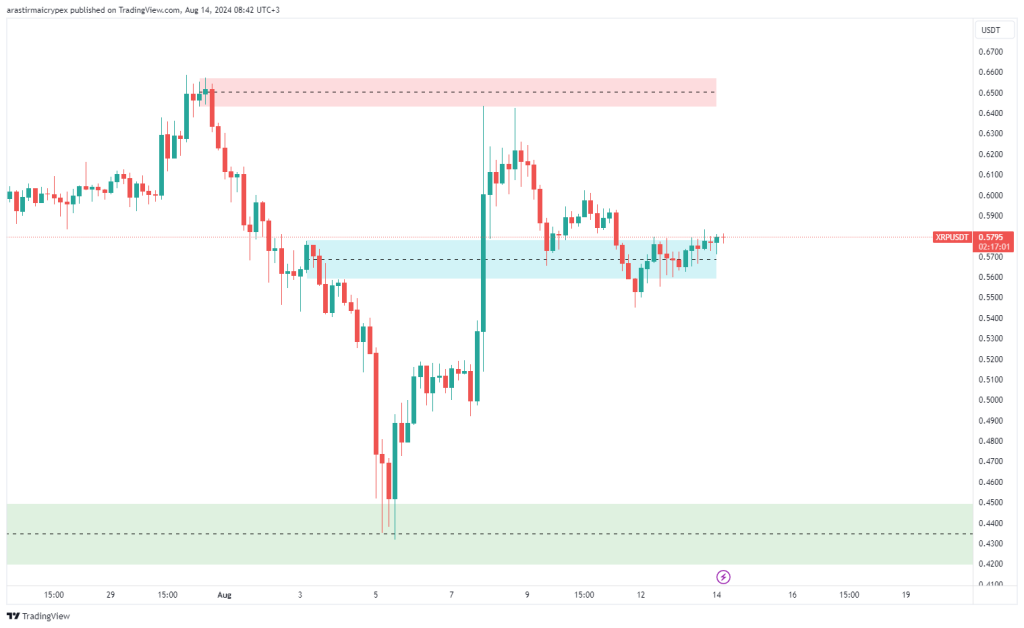
RIPPLE (XRP)
XRP is priced at $0.58 with a 0.55% increase in value as of the morning hours. It rose to $0.65 due to the news, but it was not permanent. In pullbacks, a pullback to $0.54 may occur. In prices above $0.60, increases to $0.70 may be seen.
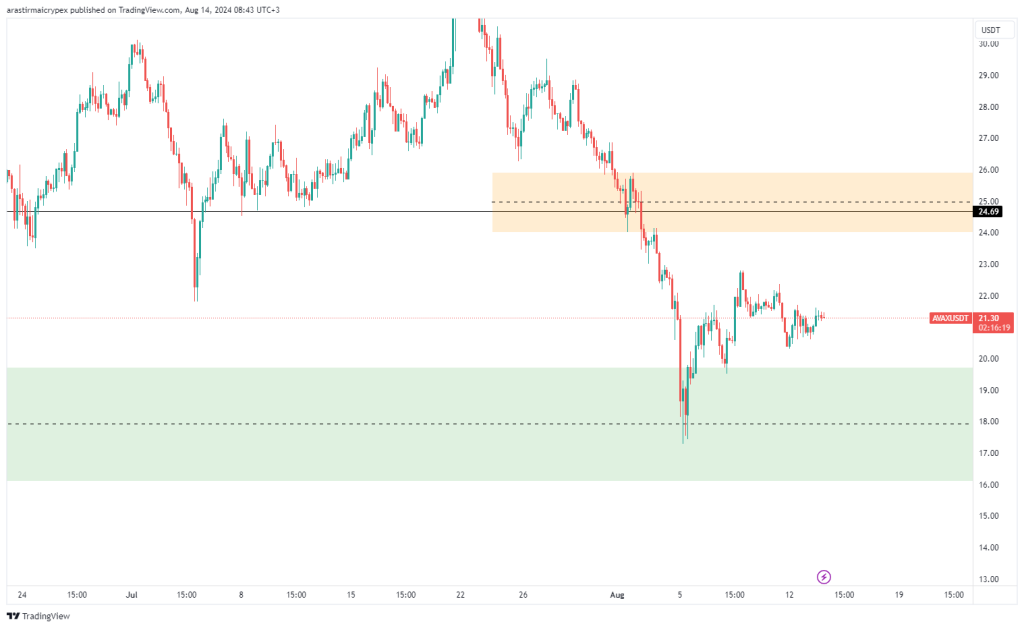
AVALANCHE (AVAX)
AVAX is priced at $21.30 with a 0.28% loss in value as of the morning hours. It was able to rise from $17.30 to $22.83. It works as resistance between $23 and $24. In pullbacks, $20 and $18 appear as strong support areas. In prices above $23, an increase of up to $25 may be seen.
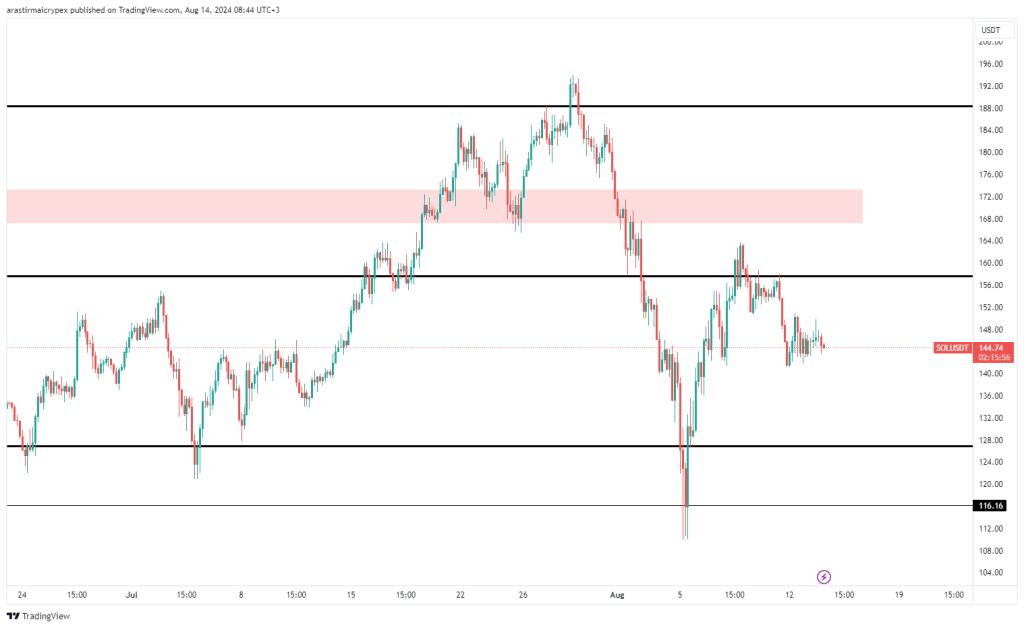
SOLANA (SOL)
SOL is priced at $144.67 with a 1.32% loss in value as of the morning hours. The pullback continues after the rise from $112 to $164. The pullback may continue to $128. If it reacts from $128, it may rise again to $170. The pullbacks are strong at $132 and $116.
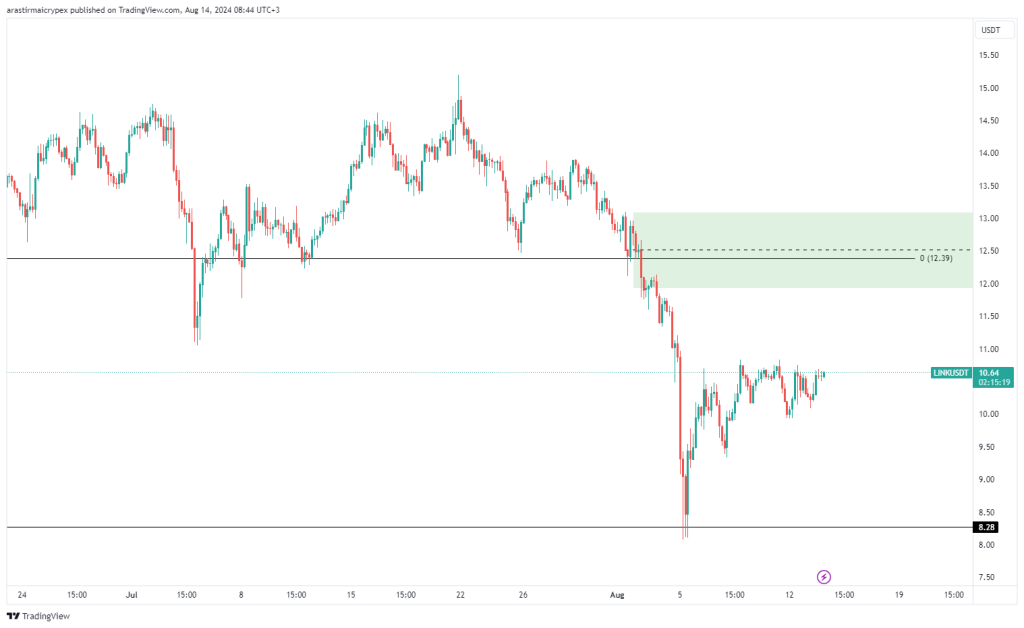
CHAINLINK (LINK)
LINK is priced at $10.64 with a 0.57% increase in value as of the morning hours. When we examine the hourly chart, LINK, which continues its horizontal movement between this level and 10.90 after breaking the 9.30 region, is performing an upward re-test of this region after breaking the 10.10 level, which is the middle band of the horizontal movement, downward. If LINK rises above this level, it can target $10.90 and then the $12 region, but if there is no upward break, we can expect a pullback to 9.30.
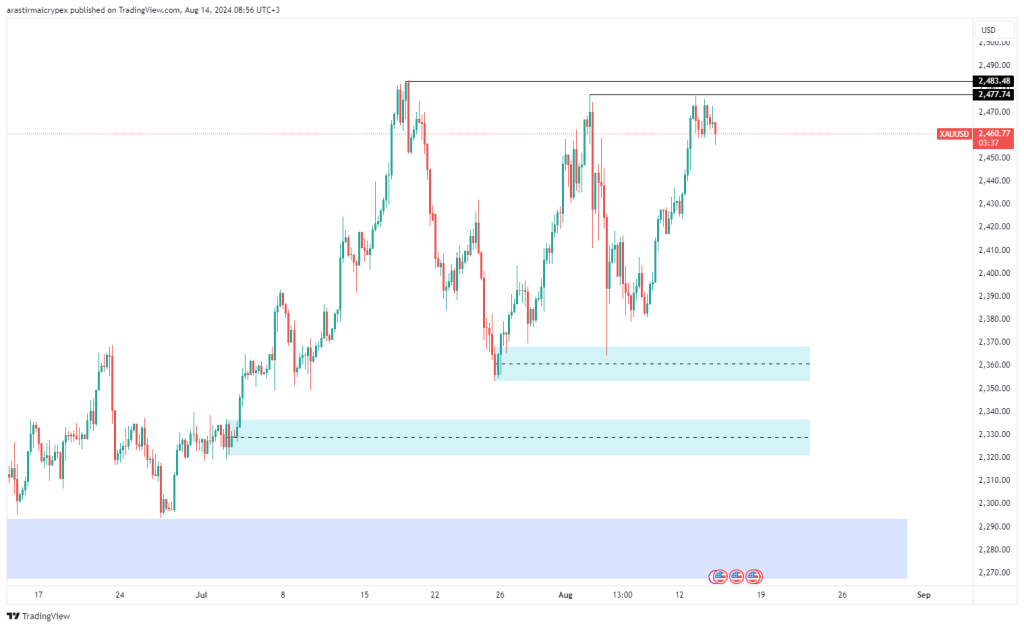
OUNCE GOLD
The ounce of gold is priced at $2461 with a 0.19% loss in value as of the morning hours. When we examine the 4-hour chart of gold, we see that it has made a horizontal movement in the range of 2360 – 2480, and that the 2420 and 2450 regions act as support in this range. The price movement was not enough for the new ATH yesterday. A new ATH can be seen in closings above $2477.
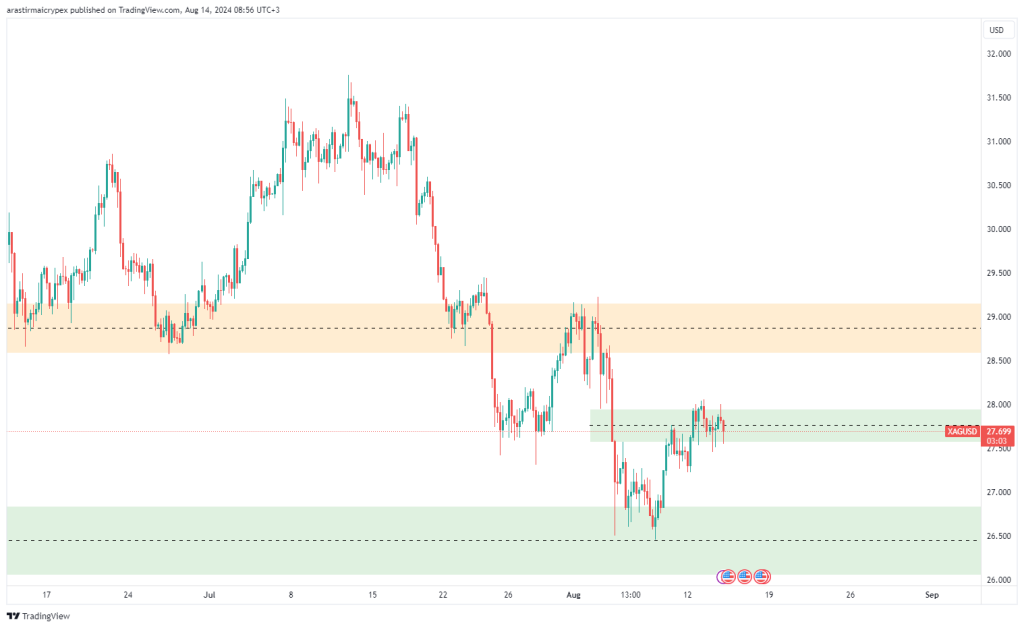
OUNCE SILVER
Silver is priced at $27.69 with a 0.58% loss in value as of the morning hours. When we examine the hourly chart, we see that the horizontal movement between the $26.50 and $27.50 levels, despite breaking upwards, could not be sustained and there was a downward movement again. If this movement continues, the $27.20 and $27 levels can be followed as support.