Trump-Backed DeFi Project WLFI Sees Record Surge in Token Sales – TRUMP Token Surpasses PEPE, SHIB to Become Second Largest Meme Coin
Trump-Backed DeFi Project WLFI Sees Record Surge in Token Sales
World Liberty Financial, the DeFi project affiliated with Donald Trump, has seen a major surge in token sales following the issuance of governance tokens and memecoins for Donald and Melania Trump. The total sales of the WLFI token increased from $91 million on Saturday to $254 million on Sunday, while the project decided to open up an additional 5% of its token supply for sale. Tron Founder Justin Sun announced an additional $45 million investment in WLFI, bringing the total investment in the Tron DAO to $75 million. The “Official Trump” and “MELANIA” memecoins attracted great interest. The former reached a peak of $72, reaching a fully diluted value (FDV) of $44.1 billion, while the MELANIA token’s FDV rose to $7.6 billion and traded volatilely.
TRUMP Token Surpasses PEPE and SHIB to Become Second-Largest Memecoin
The TRUMP token launched by President-elect Donald Trump has become the second-largest memecoin by market cap, surpassing Pepe (PEPE) and Shiba Inu (SHIB) shortly after its launch. The token has rapidly increased in value with a wave of listings on popular exchanges, reaching a market cap of $13.5 billion. However, the fact that 80% of TRUMP tokens are concentrated in companies affiliated with the Trump Organization poses a risk of centralization and market manipulation. Experts warn that this could have negative effects on the long-term reliability of the project.
Ethereum’s Pectra Update Coming in March 2025
Ethereum developers have announced that Pectra, a new update focused on speed and efficiency, will be released in March 2025. Pectra includes eight major improvements, such as EIP-7702, which allows users to convert wallets into smart contracts, and EIP-7251, which increases the maximum stake of validators from 32 ETH to 2,048 ETH. Developers will test the update on the Sepolia and Holesky testnets in February. If successful, the Pectra update will be applied to the Ethereum mainnet. This update will be Ethereum’s biggest innovation after the 2024 Dencun upgrade.
$3 Billion in Options Expired on Bitcoin and Ethereum
With Bitcoin exceeding $100,000, $3 billion in BTC and ETH options expired, increasing market activity. 21,600 Bitcoin option contracts were traded for $2.2 billion, while 182,454 Ethereum contracts were traded for $612.2 million. The maximum loss point for BTC was determined as $96,000, and for ETH, it was determined as $3,250.
While the expectation of Trump’s crypto-friendly policies increased optimism in the market, the increase in short-term volatility attracted investors’ attention. After the sales in Asia and Europe, the purchases of American investors turned the market green. Analysts say the Trump era could bring new life to the crypto market.
Trump’s Portrait on the Bitcoin Blockchain
Bitcoin mining company Marathon Digital has immortalized the presidency of the new US President Donald Trump with the crypto revolution by processing his portrait on the Bitcoin blockchain. The block, dubbed “Trump 47,” was created to honor Trump’s inauguration as the 47th US President. The block, which cost 1,244 BTC (about $127,000), includes Trump’s portrait and important documents such as the U.S. Constitution and the Bill of Rights.
Marathon CEO Fred Thiel said the initiative highlights Trump’s support for Bitcoin and the potential for blockchain technology to merge with American heritage.
US States Are Considering Bitcoin Reserves
Wyoming and Massachusetts have joined the list of states considering Bitcoin reserves by introducing bills aimed at investing public funds in Bitcoin. Wyoming’s proposal would allow investments only in Bitcoin and limit funds to 3%, while Massachusetts’ bill takes a broader approach, proposing to create 10% of reserves in Bitcoin or other digital assets. About a fifth of states in the U.S. are currently considering Bitcoin reserves. All of these initiatives were brought to the agenda by Republicans after Trump’s re-election.
——————————————————————————————
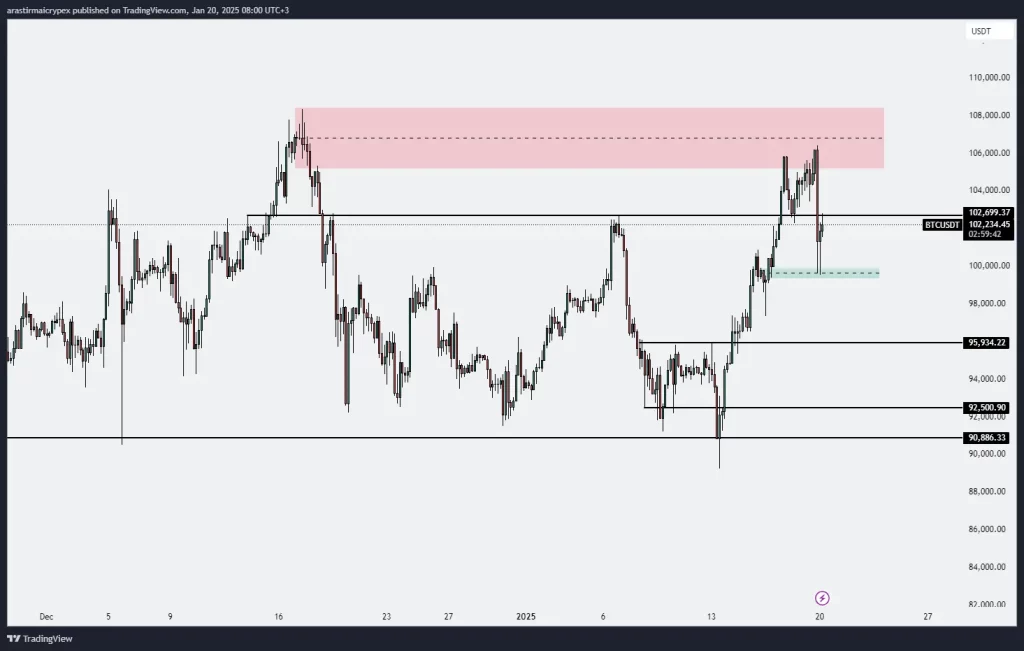
BITCOIN (BTC)
BTC is priced at $ 102,741 as of the morning hours with a 1.39% gain in value. The 102,699.37 level has become evident as a strong resistance area. There is a large sell zone (red area) just above this resistance level. The price has decreased after testing this area. In the downward movements, a support zone near the 100,000 level draws attention. This region has been tested strongly after being broken before, and the price has managed to stay above this level. Other important support levels below are 95,934.22, 92,500.90 and 90,886.33, respectively. The level of 95,934.22 in particular stands out as a short-term demand area. In the event that the price approaches the 102,699.37 resistance in its current position, it should be carefully monitored to see whether this level will be broken. If this resistance is overcome, there may be a potential for a move towards the 105,000 – 108,000 range. However, if there is another pullback from the resistance, a correction towards the 100,000 level may be seen. Therefore, in the short term, the breakout or rejection of the 102,699.37 resistance will be decisive in the direction of the price. In a downside scenario, the 100,000 level is monitored, while in upward breaks the 105,000 level can be targeted.
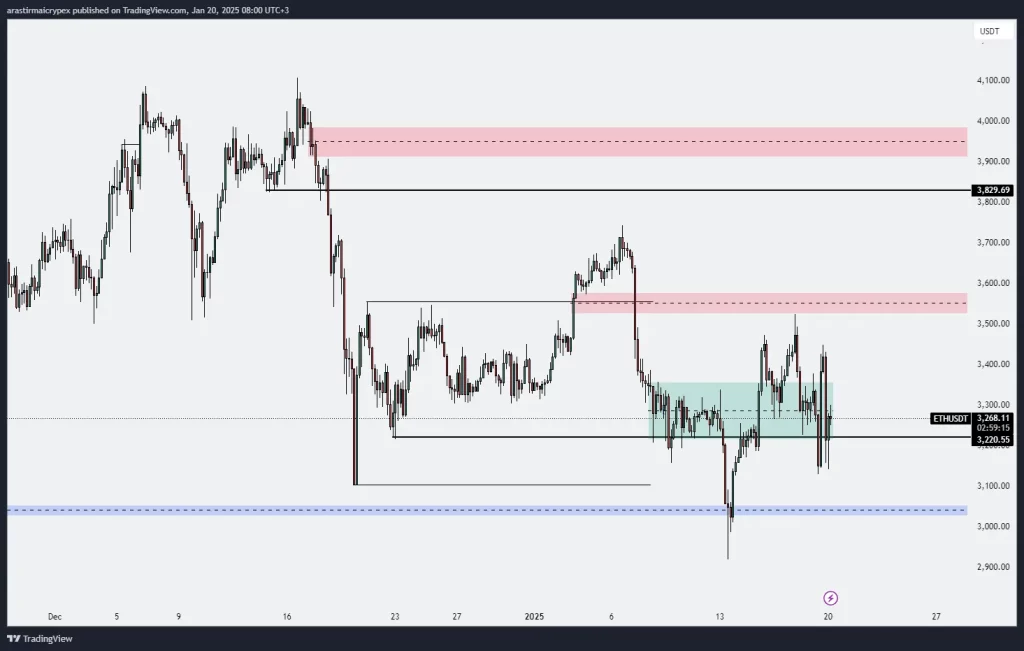
ETHEREUM (ETH)
ETH is priced at $ 3,315 as of the morning hours with a 3.14% gain in value. The turquoise colored region corresponding to the 3,350 – 3,400 range draws attention as a supply area. After each test of this region, the price has reacted downward. In the upper region, the red region around 3,600 appears as a stronger resistance area. On the lower side, the 3,220 level is watched as a short-term support. If a close occurs below this level, the price is likely to pull back to the 3,100 – 3,000 band. The 3,000 level in particular is an important psychological support area for long-term investors. Price action is currently stuck between both supply and demand zones. In order for an upward movement to continue, a break above the 3,400 level and then the 3,600 level must first be broken. Otherwise, downward pressure will likely increase and support levels will be tested. In this case, the price is likely to continue its sideways movement between the 3,220 support and the 3,400 resistance in the short term. However, breaking one of these zones will give a clearer idea of the price direction.
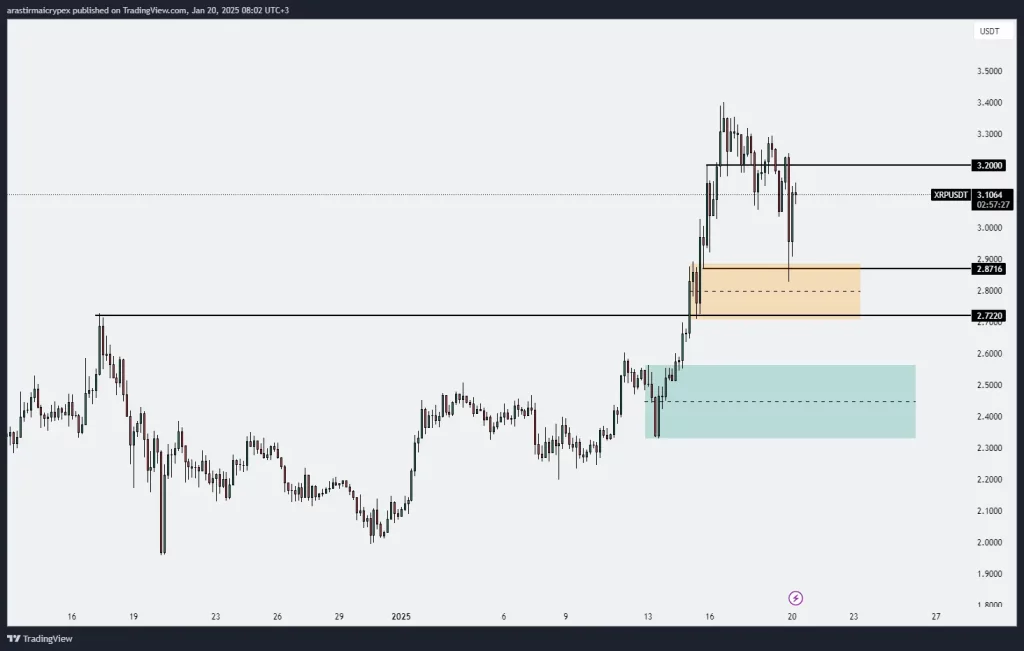
RIPPLE (XRP)
XRP is priced at $ 3.13 with a 5.52% gain in value as of the morning hours. It is seen that it was rejected from the 3,200 level and experienced a decline after an upward movement. The price is currently traded at 3,110, and the yellow zone below between 2.8716 – 2.7220 draws attention as a demand area. This zone is considered a support level where buyers are likely to step in. While the 3,200 level stands out as an important resistance point; The rejection from this level has put the price into a correction process. If the price reacts from the 2.8716 – 2.7220 support area, a recovery towards the 3.200 level can be observed again. However, a close below this level may cause the decline to deepen and the price to retreat to the demand zone at 2.50. Although the general trend is bullish, the price is currently moving towards a critical support area and whether the 2.8716 level can be maintained or not will be decisive for the short-term direction of the price movement.
AVALANCHE (AVAX)
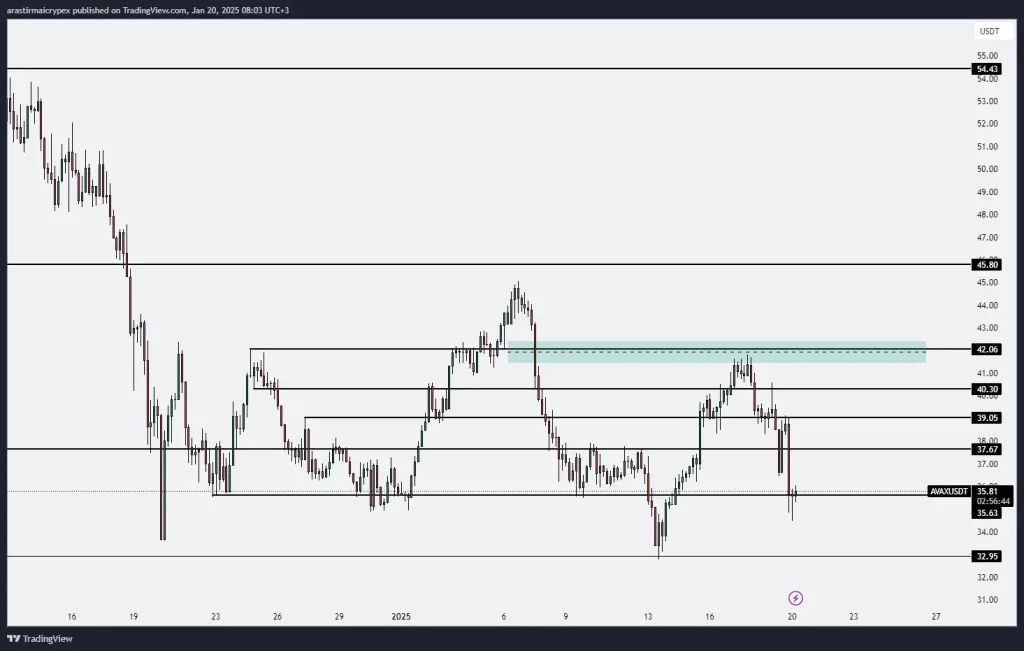
AVAX is trading at $ 36.12 as of the morning hours with a 1.26% gain in value. After rising to the resistance area at 42.06, the price was rejected from this level and remained under selling pressure. The price is currently trading at 35.81 and is very close to the support point at 35.63. On the upside, the level of 37.67 stands out as the first resistance point. If the price can break this level, the 39.05 and 40.30 levels can be monitored as the next target resistances. However, it does not seem possible to talk about a strong uptrend without being sustained above these levels. On the downside, the 35.63 level is an important support point. If this level is broken, the 32.95 level may stand out as the next support area. In addition, current market dynamics require investors to closely monitor these critical levels.
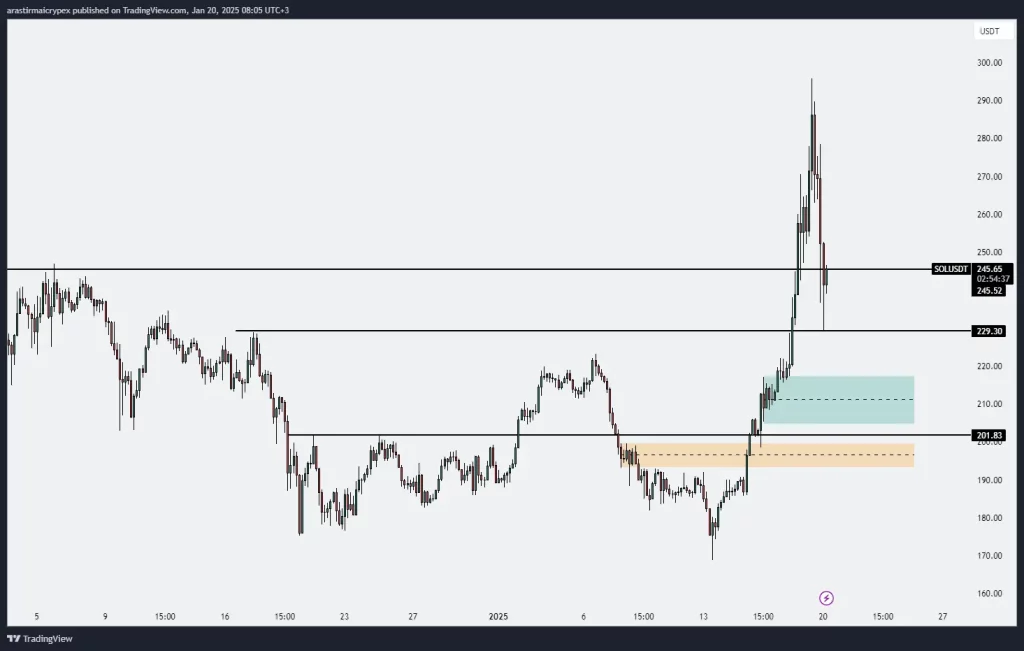
SOLANA (SOL)
SOL is priced at $ 247.90 with a 0.1.85% loss as of the morning hours. The price showed a correction movement after reaching the level of 245.73 and is currently trading just below this level. This correction movement shows that there is a strong selling pressure and investors have started to take profits. In upward movements, the level of 245.73 stands out as a strong resistance. If the price retests this level and closes above it, the probability of the uptrend continuing will increase. The 250 level could be the next target in this scenario. In downward movements, the 229.30 level can be watched as the first support point. If a break below this level occurs, the support zone in the 210 – 201 band can be tested. This area should be followed closely as it is an important area where the price has previously found buyers.
