What are Candle Patterns in Crypto?
Are you wondering when to buy or sell a cryptocurrency or how it will perform in the future? Then knowing about (crypto) technical analysis candlestick patterns can help you.
Candlestick patterns can be explained as patterns that are visually represented on financial charts and provide information about price movements. These patterns can help predict future price movements of an asset and are often used in technical analysis.
Candle formations; In addition to being used in stock, Forex, commodity, futures and options markets , it also forms an important part of technical analysis in the cryptocurrency world. The biggest reasons behind choosing this formation are that it is easy to understand and offers an attractive visual.
The act of reading candlestick charts can help traders evaluate market sentiment and potential price movements. When candlestick charts are examined, information can be obtained whether the price movement is positive or negative, as well as an impression of how large the movement is.
Each candle on a candlestick chart represents four major price levels, indicating the open, close, high and low prices of an asset over a specific time period (e.g. 1-hour, daily, weekly). For example; When the hourly chart is selected, each candle visible on the screen highlights a different hour. Candlestick patterns are patterns formed by the combination of these price levels.
Candle Formations and Their Meanings

Before moving on to candlestick formations and their meanings, let's look at why this type of chart is called 'candle' . The term 'candle formation' is used because the appearance of the patterns formed on the chart is similar to the physical structure of a candle. This term refers to certain patterns on bar charts used to represent price movements in financial charts.
If there is one thing that does not change, it is that each candle has a body and two wicks.
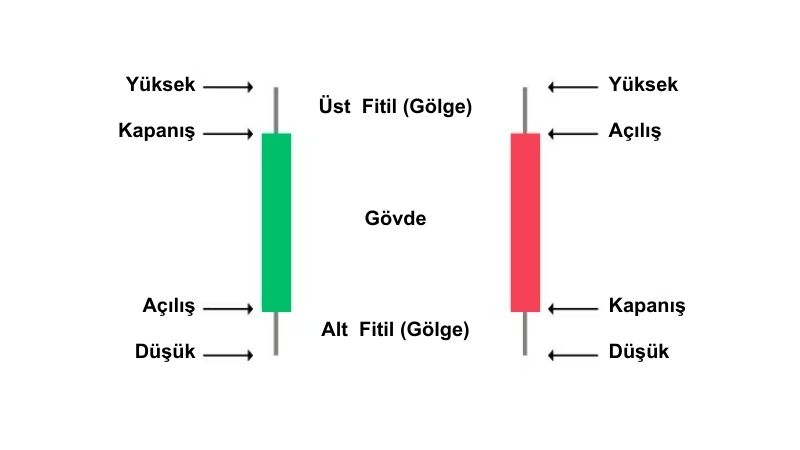
Candle body refers to the region between the opening and closing prices in the selected time period. Candle wicks are thin vertical lines coming from the bottom and top of the body. Candle wicks, like the candle body, mark the highest and lowest prices in the selected time period. These candles consist of two colors : green and red .
Green candles indicate uptrends, while red candles indicate declines. In green colored candles, the upper part of the candle body represents the closing price in the selected time period, while the lower part of the candle body represents the opening price. In red colored candles, the upper part of the candle body represents the opening price, while the lower part of the candle body represents the closing price.
After this basic information for the act of reading candlestick charts, different candle formations must be recognized in order to predict future price movements. You can familiarize yourself with some of them below and benefit from them while performing technical analysis.
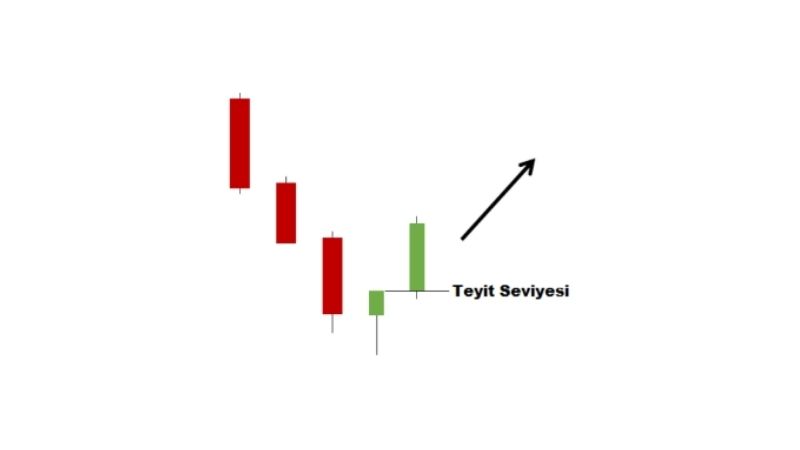
Engulfing Bull Formation
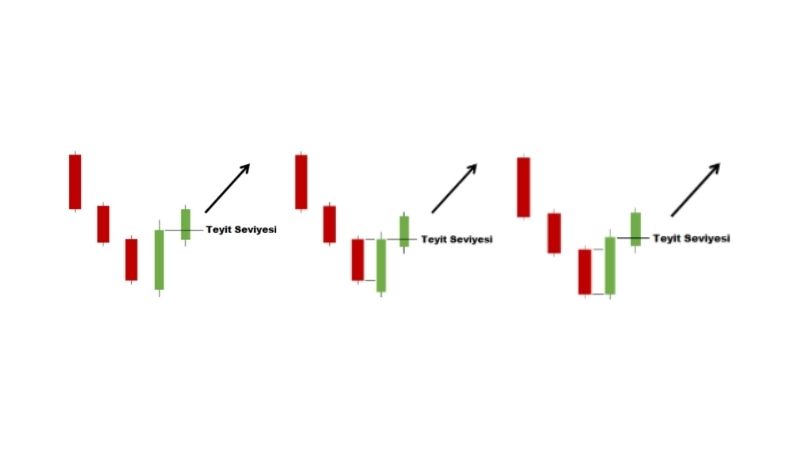
Bullish engulfing candle formations can be said to be a harbinger of a trend reversal . It emphasizes a development in which buying pressure increases and selling pressure becomes difficult. It may be a strong choice for investors to strengthen the possibility of buying at the bottom . If the green candle formed at the end of a falling trend is large enough to swallow the previous red candle, that is, if the body of the green candle is much larger than the body of the red candle before it, it can be said that a bullish engulfing formation has emerged. Of course, it is important to remember that there should be a gap, even if small, between the opening and closing prices of both candles.
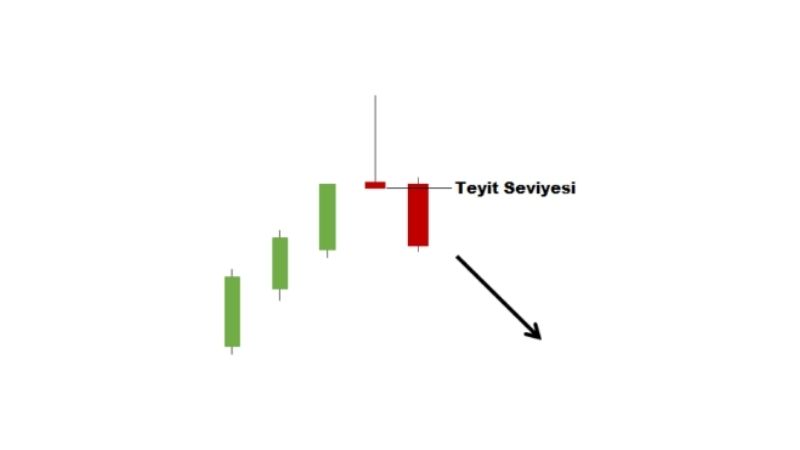
Bearish Engulfing Candle Formation
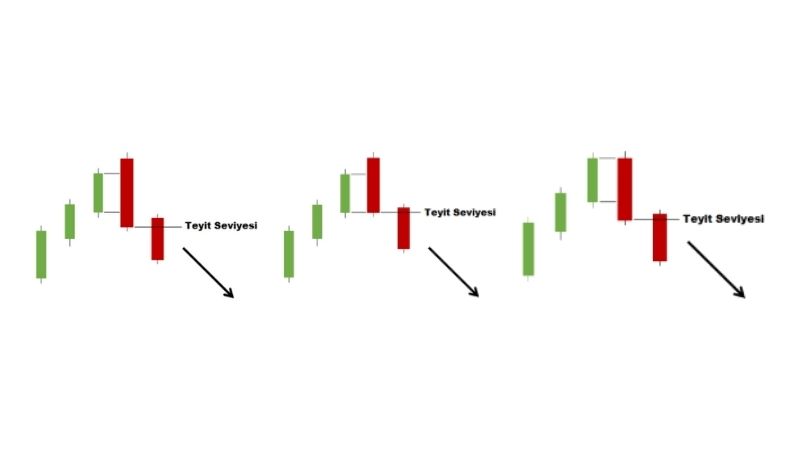
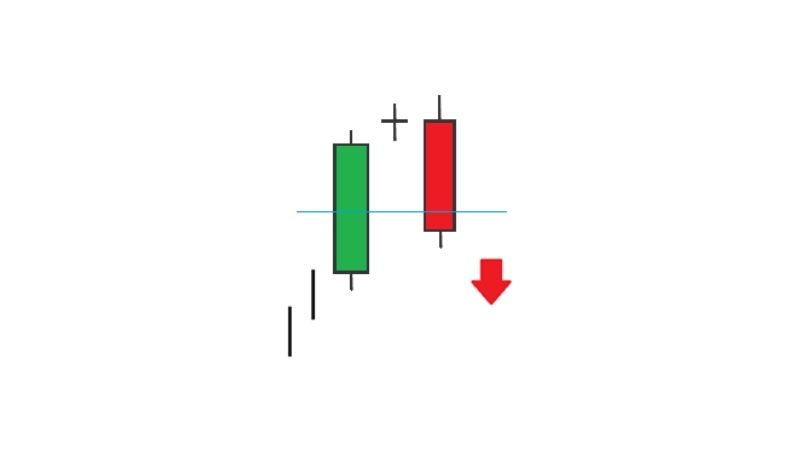
The engulfing bear formation, as its name suggests, emphasizes the downward trend and consists of two candles. The order here is that my first candle is green and my second candle is red. The red candle is larger than the first candle (green candle). That is, the body of the red candle is larger than the body of the green candle. There is also a difference between both the opening and closing values of the two candles. It should be underlined that this formation will occur at the top of the uptrend.
As a result, the bearish engulfing candle formation may indicate that selling pressure is strengthening and a downtrend may be coming.
Hammer Bull Formation (Hammer)
The hammer bull formation is a type of candlestick chart formation that can be frequently encountered at the bottom of a falling trend . Hammer candle formations are called hammer due to their shape. After opening, it encounters a harsh selling pressure and closes at the highest value of the day. As a result of these movements, the candle body forms at the top and there is a long wick below. It is considered a rule that the wick below should be at least twice as long as the candle body. There should be no wick at the top of the candle or it should be almost negligible. The body color of the candle designated as hammer can be green or red. The expectation from the confirmation candle is that it will close at a value higher than the highest value of the hammer candle.
Dragonfly Doji
Dragonfly doji can be translated into Turkish as dragonfly doji. It resembles a dragonfly in shape and thanks to this feature, it can be easily recognized when it forms. Dragonfly doji candlestick pattern refers to a candlestick where the opening and closing prices are very close to each other or the same. A dragonfly doji appearing after a downtrend may indicate that the price will increase. A dragonfly doji that appears after an uptrend may indicate that the price will move downwards. To strengthen the narrative, this formation can be likened to a war between buyers and sellers. To confirm who won this battle, the signal can be confirmed by checking the confirmation candle.
Gravestone Doji (Gravestone Formation)
Gravestone Doji, which may be considered the first among Doji formations, can be said to represent buyer-seller wars . This formation, which is called gravestone doji in Turkish, can be considered as an indicator that sellers are more dominant in the face of an upward trend in the price. The distinctive image of this formation is that the candle body is almost absent and the upper wick is quite long. Although this image signals that the sale will increase, it would be healthier to wait for the next candle close to get an impression of whether the sale will continue or not. Closing the confirmation candle at a level lower than the lowest price of the gravestone doji candle may strengthen the possibility that this formation may work.
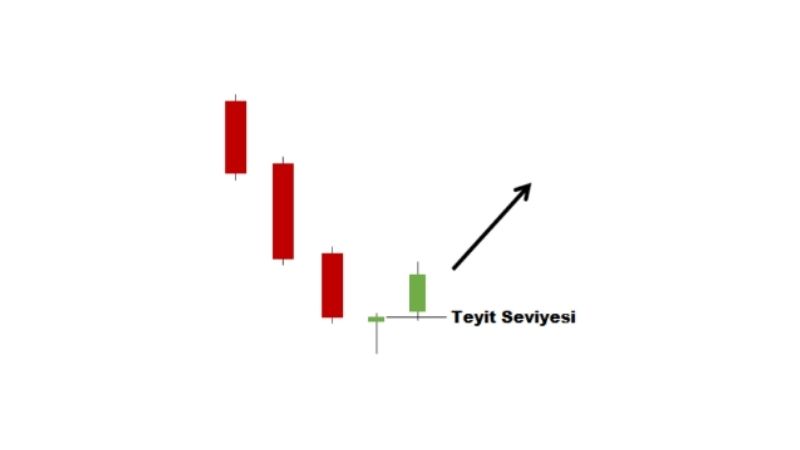
Pregnant Bull Formation
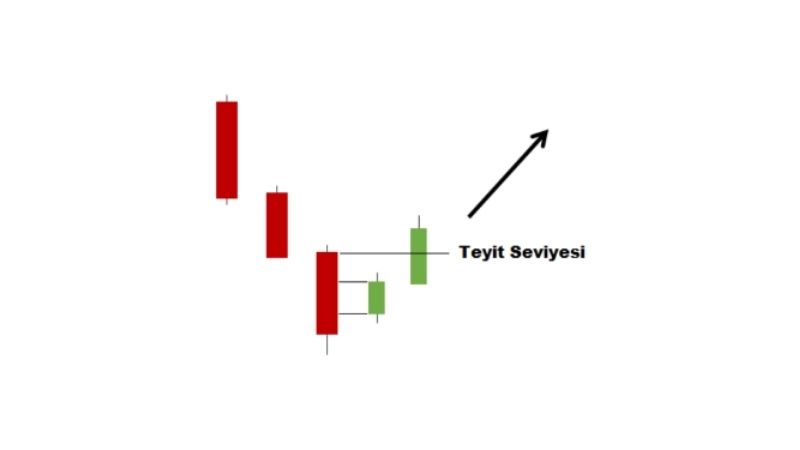
Pregnant bull formation is relatively rare in the markets. Bullish candle formations consist of a green candle with a short body at the end of a falling trend, which is lower than the opening price and higher than the closing price of the preceding red candle. A confirmation candle is needed here again. The candle to be viewed as confirmation must have closed at a level higher than the opening price of the red candle preceding the pregnant bull candle.
Flag Formation
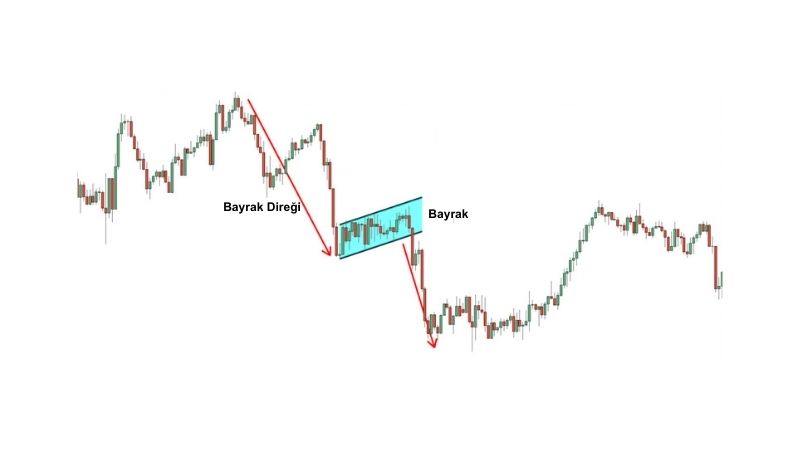
The flag pattern usually represents a short-term gap in price movements. A flag formation occurs when the price of a financial instrument fluctuates over a period of time, creating a flag-like pattern . This pattern usually indicates that the previous strong trend will continue. Flag formation consists of two main parts: flag pole and flag. The flagpole usually represents a strong price movement, either upward or downward. The flag indicates the short-term correction or consolidation period that follows this movement.
The flag formation occurs as a result of a very sharp upward movement in the first movement and this creates the pole of the flag . If this movement could not be caught by investors, the flag formation can be followed. The moment when the upper point of the flag formation breaks can be considered as a signal to enter the position. At this level, there is a significant increase in volumes. If the expected increase in volume does not occur, the formation becomes obsolete.
With the completion of consolidation after the flag formation, the price is expected to move at the same height as the flagpole. A strong volume is seen after the break in the flag formation. If there is no volume, the formation is not valid. It can be observed that the formation occurs in different directions in the bear and bull markets. It is expected that a downward pattern will emerge in the bear market and the decline will continue as long as the pole length. In a bull market, the outlook is upward and a rise is expected up to the pole height.
Hanging Man Candle Formation
Hanging man candle formation is also known as hanging man formation in the market, which is the English equivalent of this formation. It is notorious as a trend reversal formation. It occurs at the peak of an uptrend. As a result of the struggle between buyers and sellers, the candle body forms in the upper part and the candle wick becomes long in the lower part. When such a formation is encountered, it can be a signal that the rising trend has come to an end and the new trend will be downward.
In this type of formation, the formation or absence of gaps does not cause the formation to deteriorate. However, when it comes to the end of the uptrend, the candle that leaves a gap is more likely to work than the candle that does not leave a gap. It should also be noted that hanging man candles can work whether their body color is red or green.
Abandoned Baby Bull Formation
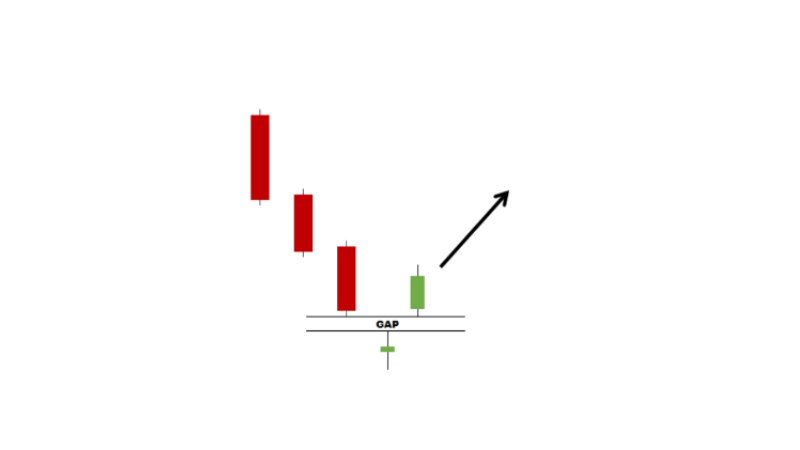
The bullish abandoned baby formation, which is translated into Turkish as the abandoned bull formation, may be a harbinger of developments indicating that a falling trend has ended and a new upward movement may begin. Doji is included in candle formations . The criteria for this formation are that it appears after a falling trend, that it forms with a gap gap, that the candle body is short, and that it starts the uptrend with a gap gap. If there is a candle body, it does not matter whether it is green or red.
The green closing of the candle, which opens with a gap after this candle, is determined as the criterion to be looked at for the approval of this formation. In this formation, the main point to focus on is the formation of gaps before and after the relevant candle.
Doji Evening Star Pattern
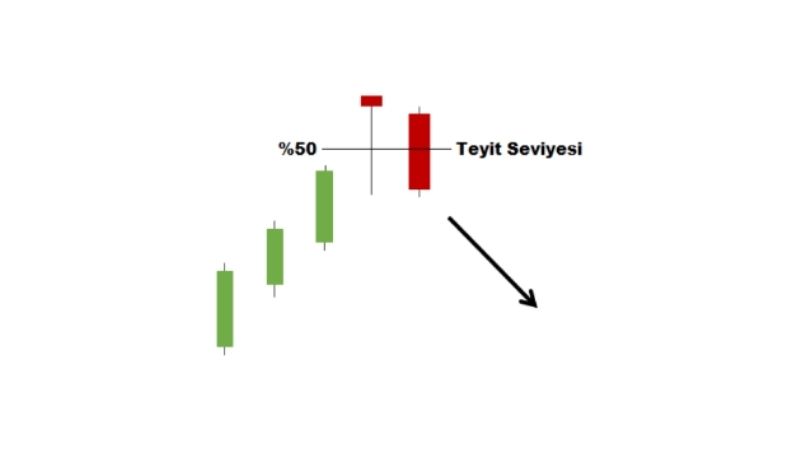
Doji Evening Star formation is one of the frequently encountered candlestick chart formations. Appearing at the top of an uptrend, this candle is almost non-existent. In fact, this emphasizes that it is a candle without a body and can lead to an inference that the trend direction may change. In this formation, known as Evening Doji Star in English, the opening and closing prices of the candle must be at the same or higher level as the opening and closing prices of the previous candle. The confirmation candle is expected to close lower than the Doji Evening Star candle.
The Most Reliable Candle Formations
In fact, it would not be correct to use the term 'the most reliable candle formations'. The reliability of candle formations that can be considered reliable today may change over time and they do not always give accurate results. However, some popular and often considered candle formations can be mentioned. These are as follows:
Popular Bullish Candlestick Patterns
- Hammer Bull Formation
- Dragon Fly Doji Pattern
- Pregnant Bull Formation (Bullish Harami)
- Abandoned Baby Bull Formation
Popular Bearish Candlestick Chart Patterns
- Hanging Man Formation
- Gravestone Doji Formation (Gravestone)
- Bear Engulfing Formation
- Doji Evening Star Pattern
It should not be forgotten that any candle formation alone does not give a definitive buy or sell signal. It should be used in conjunction with other technical analysis tools and market conditions. Additionally, market conditions may change over time. Therefore, trading based on candlestick patterns alone should be avoided.