IBIT, BlackRock’s Spot Bitcoin ETF, Outperforms MicroStrategy
BlackRock iShares Bitcoin ETF (IBIT) has more Bitcoin holdings than MicroStrategy in less than two months. According to the fund’s latest statement, IBIT reached 195,985 BTC at the close of Friday. MicroStrategy, the world’s largest corporate Bitcoin owner, has 193,000 BTC.
High Increase in Bitcoin Transaction Volume and Miner Revenues
According to data, the volume of Bitcoin moved last week reached the highest level in the last 18 months and miner revenues increased accordingly. When we examine the details, the transaction volume on the Bitcoin network exceeded its highest level since September 2022 and reached 76 billion dollars. Additionally, miner revenues also increased, approaching the May 2021 peak of $65.4 million. The halving, which will take place in approximately 40 days, is of great importance, especially for miner income.
SEC Delays Decision on Bitcoin Options Until April
The U.S. Securities and Exchange Commission (SEC) has postponed its decision on a proposal to publicly list options on Bitcoin ETFs scheduled to trade on the CBOE. Although CBOE made the application in January, the SEC announced that it postponed its decision until April.
Ethereum Dencun Upgrade Will Take Place on Wednesday
Dencun, Ethereum’s long-awaited upgrade, will take place on Wednesday. Following the latest Shapella update, a major decrease in Layer-2 costs is expected with this highly anticipated upgrade. This upgrade, which has been successful on test networks in recent weeks, will be officially active on March 13.
637 Million Smart Contracts Used in EVM Chains Since 2022
Before the Dencun development that will take place on Wednesday, all eyes are on Ethereum and EVM projects in the cryptocurrency market. In the data shared over the weekend, it was stated that the amount of smart contracts made available by EVMs since January 2022 has reached 637.9 million. When looking at the chain distributions, it was seen that Polygon took the lead with 34.25% in the contract amounts used, while BSC ranked second with 32.8% and Optimism ranked third with 17.80%. Additionally, it was noteworthy that 34.7% of the contracts were DeFi-related contracts.
Arbitrum DAO Drops Offer to Fund Tornado Cash Developers’ Legal Bills
The plan was originally to donate approximately $1.3 million worth of ARB tokens to Tornado Cash cryptocurrency mixer developers Alexey Pertsev and Roman Storm. Funds are also available for privacy-preserving, lobbying and public sales campaigns. The charges against Tornado Cash and its owners allege that the site laundered more than $1 billion in illicit funds, some of which was linked to the hacker group Lazarus Group. The developers face US charges for running an unauthorized money transfer business, money laundering and violating sanctions.
Moonbirds Creator Kevin Rose Sells NFTs Worth $1.2 Million
Kevin Rose, co-founder of NFT project PROOF, sold his NFTs worth more than $1.2 million, although he denied reports that he was leaving the Web3 space entirely.
Rose sold several high-value NFTs on March 9, including a one-of-a-kind piece by artist XCOPY for 151.2 ETH and a piece from the Fidenza series by Tyler Hobbs for 142 ETH.
——————————————————————- —————————–
BITCOIN(BTC)
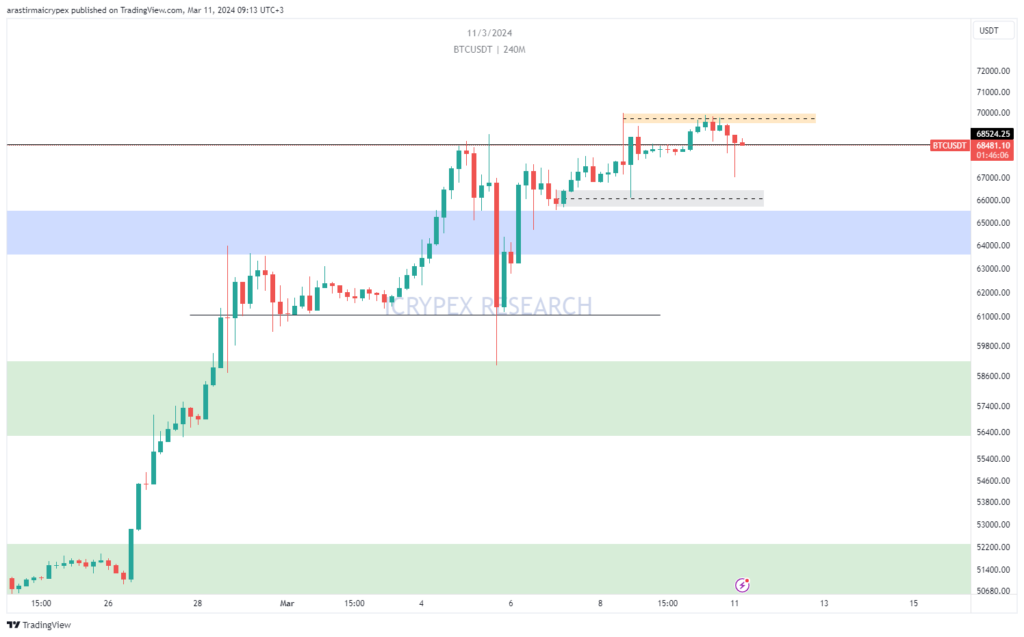
As of the morning hours, BTC is priced at $68,522 with a 0.64% gain in value. After rising to $70,000 on Friday, there was a pullback. $66,000 appears to be the support level. If it retreats to $66,000 and receives support, it can reach the $70,000 level again. If it reaches above $ 70,000, the first target will be 71,000 and then 72,000. Since we generally do ATH, it is now difficult to determine the resistance level.
ETHEREUM(ETH)
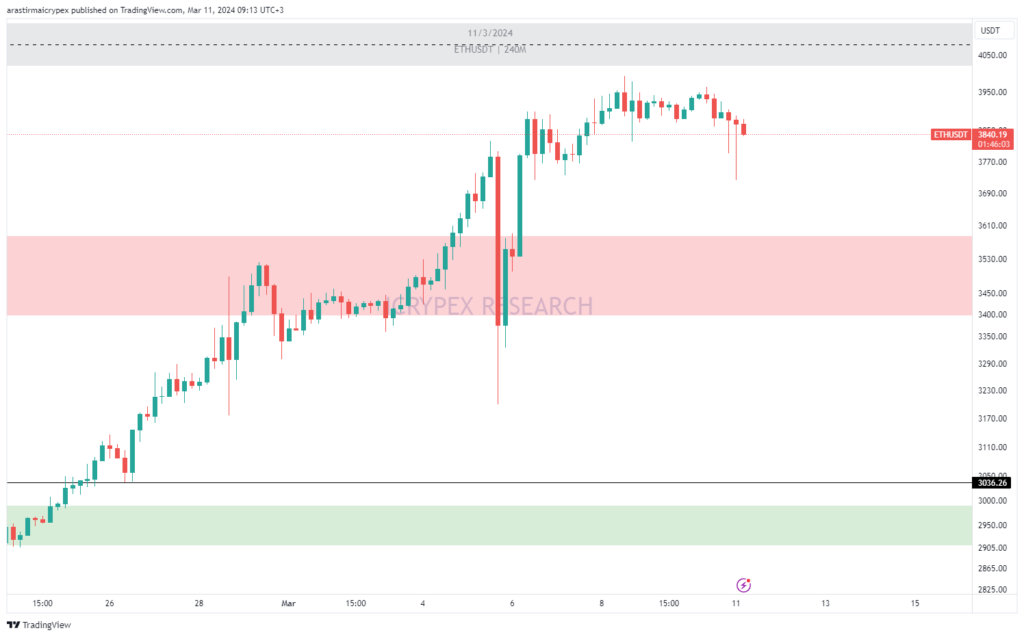
ETH is priced at $3840 with a 0.95% loss of value as of the morning hours. After the rise to $ 3995, the retreat continues. It seems to have received support at $ 3723 in the morning hours. If this downward correction continues, a rise to $3970 may be seen. If a deeper pullback occurs, price movement up to $3600 could be seen.
RIPPLE(XRP)
XRP is priced at $0.6065 with a 0.63% loss of value as of the morning hours. When we examine the four-hour chart, we see that there was an upward reaction movement, but it could not be sustained above the $0.64 level. If this region is crossed, a movement towards the $0.70 region may be possible. In case of a withdrawal, the $0.60 level can be followed as support.

AVALANCHE(AVAX)
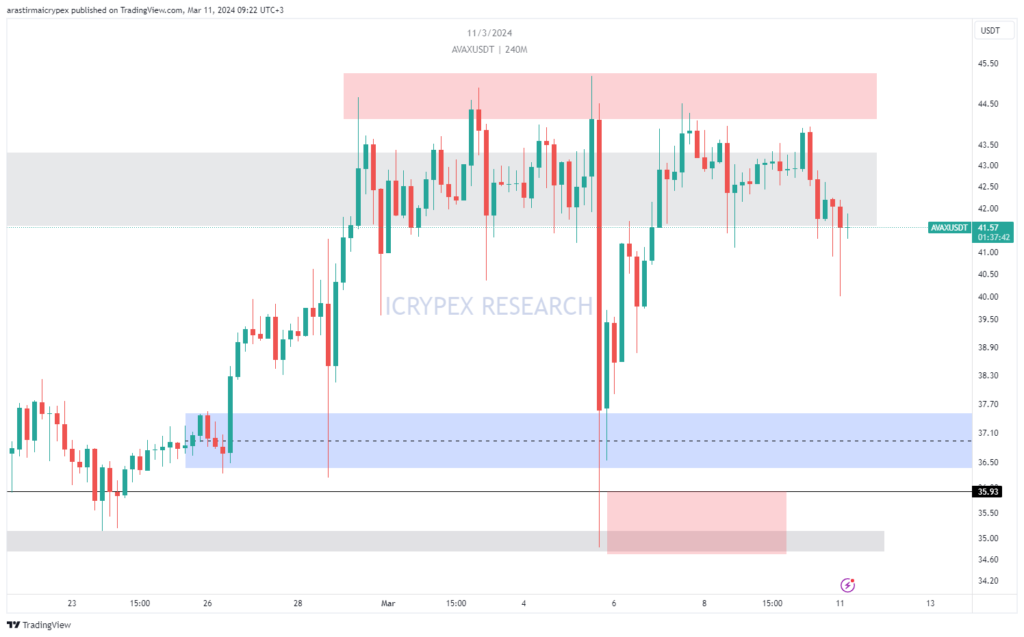
AVAX is priced at $41.57 with a 1.14% loss in value as of the morning hours. When we evaluate the four-hour chart, we see that the resistance zone of $44.50 is working well. If this region breaks upwards, prices above $50 may be seen. In the short term, in case of an upward break of the $44 level, the $50 level can be followed as resistance. In case of a withdrawal, the $41 level can be followed as support.
SOLANA(SOL)
SOL is priced at $141.10 with a 2.29% depreciation as of morning hours. When we examine the hourly chart, we see that the support zone of $142 has been broken downwards. Additionally, it is noteworthy that there is a downward movement with the falling trend line. If this movement continues, a move towards the $136 region may be possible. In upward movements, if there is a persistence above the $ 142 level, the $ 145 region can be followed as resistance.

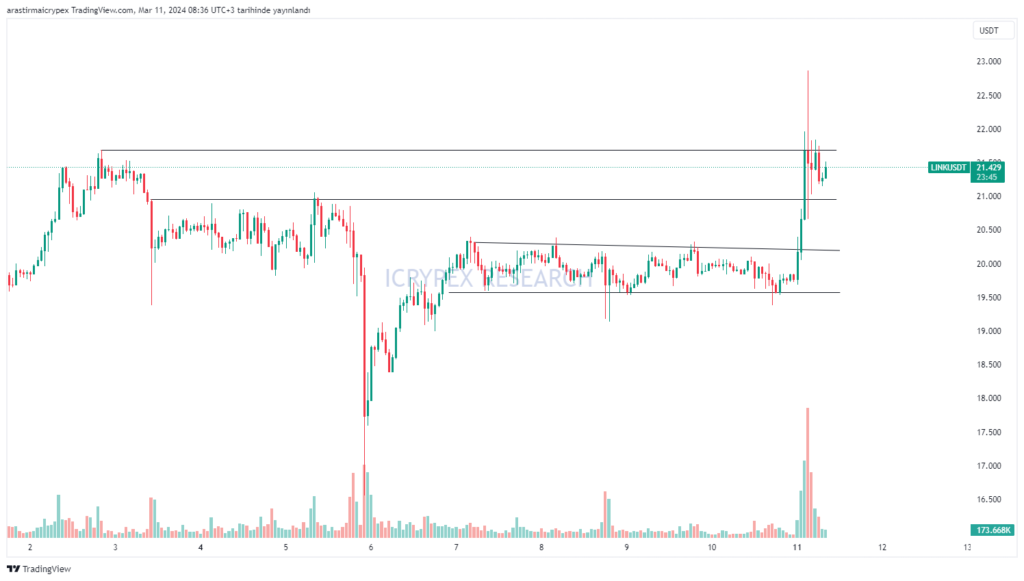
CHAINLINK(LINK)
As of the morning hours, LINK is priced at $ 21,425 with a 1.17% loss in value. When we examine the hourly chart, we see that the strong movement took place with the break of the $ 20 level, which is the resistance zone, and it shot up to the $ 23 level. The $21.70 level appears as an important resistance for LINK, which fell to the $21,445 level with a slight retreat from this region. If it persists above this region, the $22.5 level can be tested again. In case of a withdrawal, the $21 level can be followed as support.
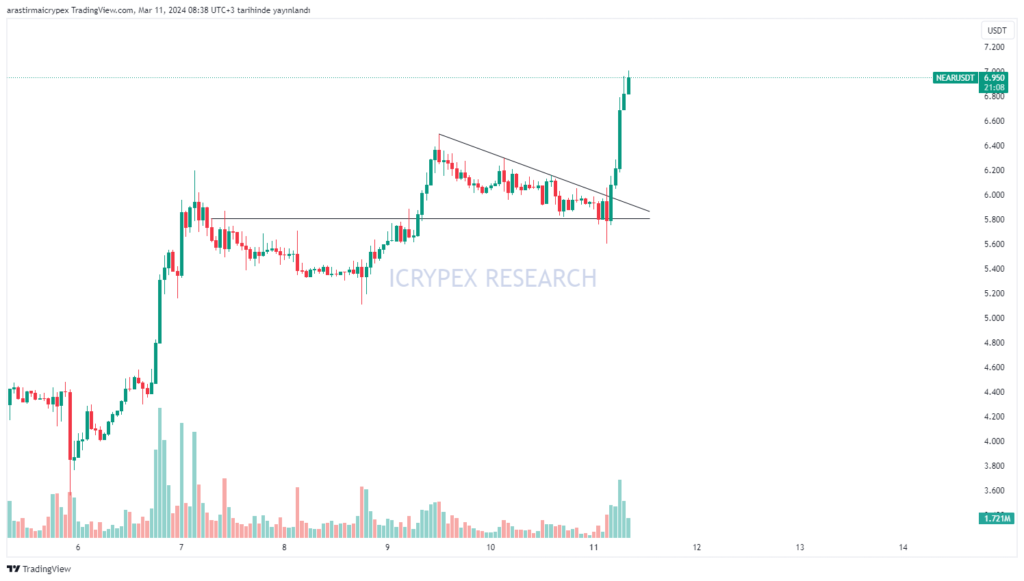
NEAR
NEAR is priced at $6,945 with a 16.75% gain in value as of the morning hours. When we examine the hourly chart, we see that the resistance zone of $6 was passed with the falling trend break. If this movement continues, the $7 level can be followed as resistance, and if it persists above this region, the $7.5 level can be tested. In case of a withdrawal, the $6.8 level appears as support.
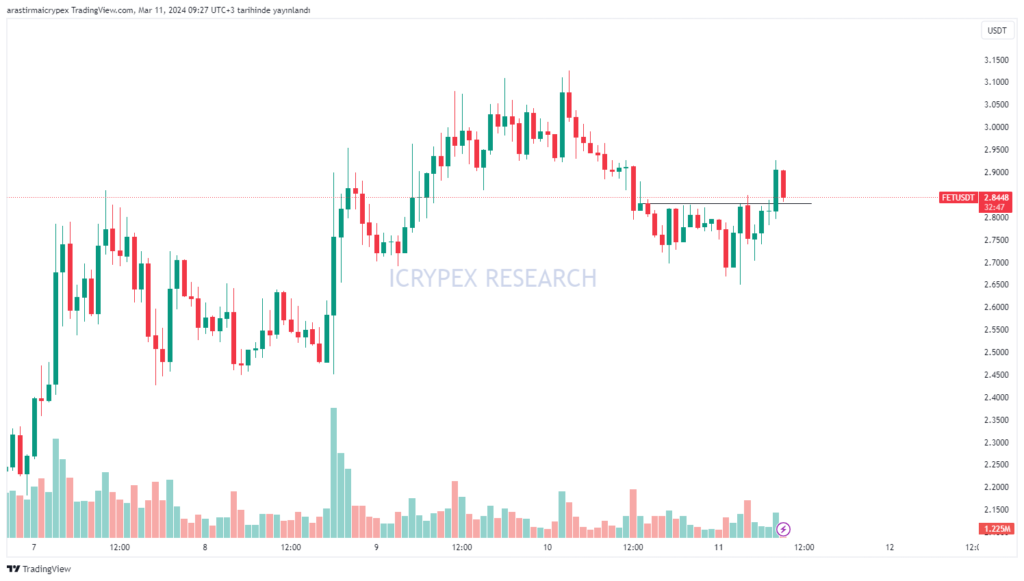
FET
As of the morning hours, FET is priced at $2.8932 with a 4.55% gain in value. When we examine the hourly chart, we see that the resistance zone of $2.83 has broken upwards. If this movement continues, the $3 level may be tested. In case of a withdrawal, the $2.85 level can be followed as support.